Will the 100 SMA Keep EUR/USD Bullish?
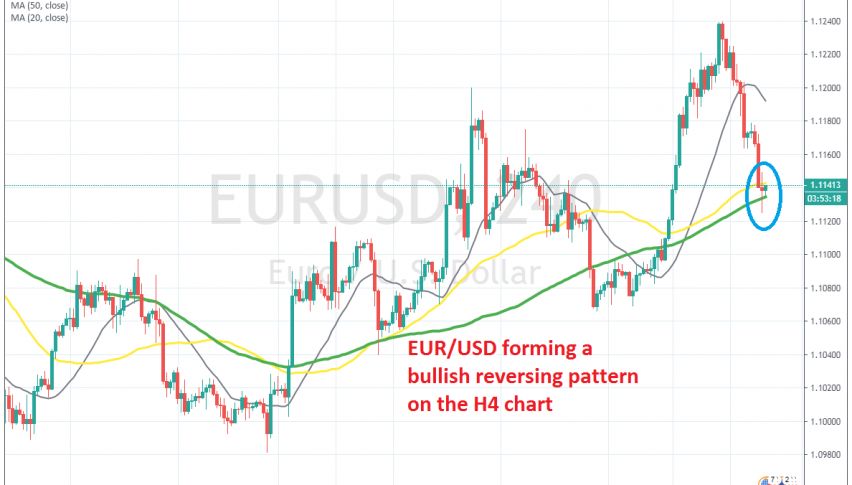
EUR/USD has declined more than 100 pips in the last two days, but the 100 SMA is holding as support on the H4 chart

[[EUR/USD]] has been bullish during December. The Euro doesn’t have many reasons to be bullish, but the USD turned bearish last month, due to the soft US ISM manufacturing report, as well as due to some year-end cash flows out of the US apparently.
As a result, EUR/USD climbed from below 1.10, to 1.1240s during last month. But, in the last two days this pair has given back around 100 pips, particularly today. The sentiment has deteriorated today, after the killing of the top Iranian military general from the US.
Risk currencies have been making some sharp declines, while safe havens have surged higher. But, it seems now that the decline in EUR/USD has stopped. The price pierced below the 100 SMA (green) for a short while, but climbed above it again, which suggests that this moving average might have turned into support now.
The 100 SMA provided resistance back in November for some time on the H4 chart, when this pair was bearish. The previous H4 candlestick closed as a spinning bottom/doji, which is a reversing signal, while the stochastic shows that this pair is oversold now.
So, this might be a good case for buyers to go long and the price is already bouncing off the 100 SMA, but it’s not given that the uptrend will resume, because the situation between the US and Iran might escalate, which would turn this pair bearish again.
- Check out our free forex signals
- Follow the top economic events on FX Leaders economic calendar
- Trade better, discover more Forex Trading Strategies
- Open a FREE Trading Account


