Shorting USD/CAD at the 100 SMA
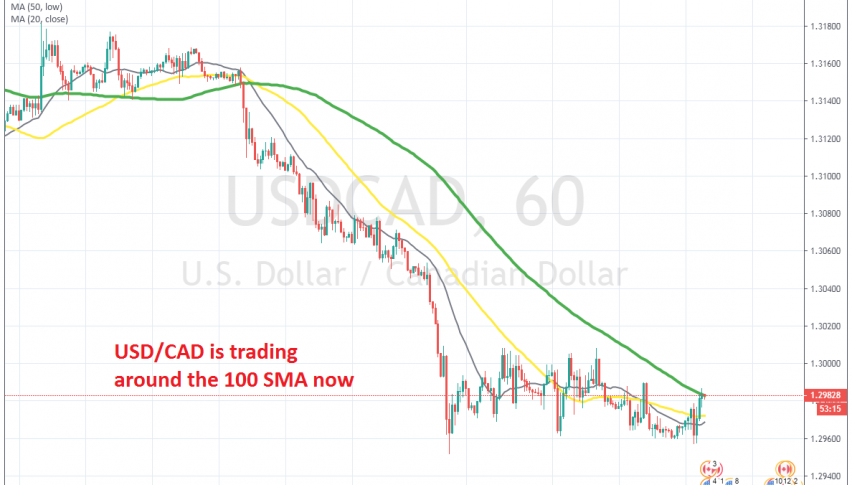
USD/CAD has retraced higher today, but the main trend is pretty bearish and the 100 SMA might turn into resistance, so we went short here
[[USD/CAD]] has turned quite bearish since the beginning of December. OPEC+ decided to cut Oil production by an additional 50k barrels/day back then and US WTI crude climbed above the big round level at $60, which helped the CAD turn bullish and USD/CAD turn bearish.
Then, in the last week of 2019, cash was flowing out of the US for the year-end and this pair got another kick down. 1.30 was broken and USD/CAD fell to 1.2950s. During the decline, the 20 SMA (grey) was providing support, but in the last few days we have seen a consolidation.
The 20 SMA and the 50 SMA (yellow) caught up with the price and USD/CAD has moved above and below them, so they have lost importance as resistance indicators for now. But, the price is trading around the 100 SMA on the H1 chart after this retrace higher today, so it seems like this moving average might be turning into resistance now. We decided to go short from there.
Crude Oil has retraced lower today, but the main trend is still bullish. Once the bullish trend resumes in Oil, USD/CAD will likely resume the downtrend, so we’re holding on to this trade.
- Check out our free forex signals
- Follow the top economic events on FX Leaders economic calendar
- Trade better, discover more Forex Trading Strategies
- Open a FREE Trading Account
- Read our latest reviews on: Avatrade, Exness, HFM and XM
Related Articles


Sidebar rates
Related Posts
