USD/CAD Forms a Bearish Reversing Pattern at the 20 SMA on the Daily Chart
USD/CAD has retraced higher but the retrace seems complete on the daily chart now
[[USD/CAD]] turned bearish in December, as the CAD turned bullish, following Crude Oil after OPEC+ decided to cut production again and place new quotas of 50k barrels/day, on top of the previous ones. As a result, USD/CAD remained bearish all month and lost nearly 400 pips from top to bottom.
But the situation for this pair improved after the attacks on US military bases in Iraq, from Iran, which retaliated for the killing of Soleimani. US didn’t attack back and tensions de-escalated, which declined the demand for Crude Oil, after the initial fears of a war in the Middle East.
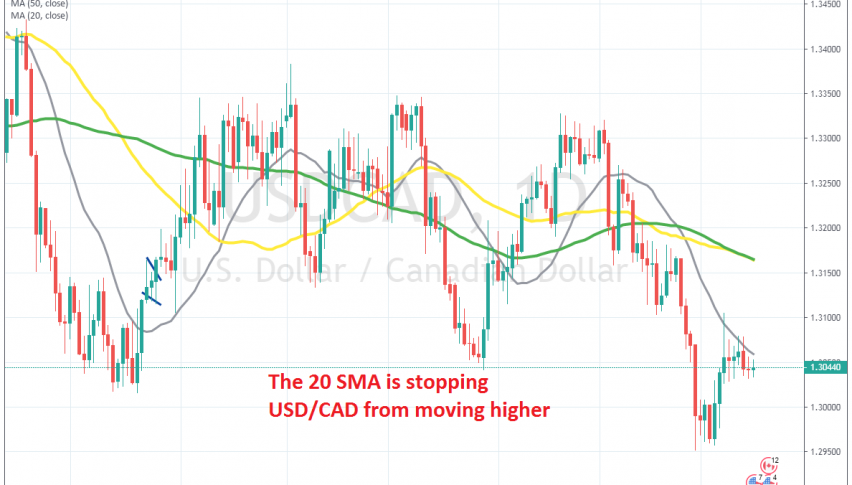
The CAD turned bearish this month and USD/CAD pushed higher. But, it has been finding resistance at the 20 SMA (grey) on the daily chart. That moving average has been pushing highs lower, which is a sign that buyers might be losing steam. The retrace is also complete on this chart now, so a bearish reversing pattern has formed.
Will USD/CAD turn bearish from here? There are quite a few factors for this such as, the economic data from Canada and the US, the BOC and the FED, market sentiment, as well as the price action in Crude Oil, but the technical analysis points down on the daily time-frame.
- Check out our free forex signals
- Follow the top economic events on FX Leaders economic calendar
- Trade better, discover more Forex Trading Strategies
- Open a FREE Trading Account


