Don’t Let the Recent Rally Fool You, GBP/USD Still Remains Bearish As Long As It Stays Below the 50 Monthly SMA


The GBP has been trading Brexit since June 2016 after the Brexit vote. We have seen quite a roller-coaster this year, with Theresa May’s Brexit deals being rejected and she resigning from the post as UK Prime Minister. Boris Johnson took her place later and he negotiated another Brexit deal with the EU. But, the British Parliament refused his deal as well.
But, in September we saw a slight reversal as the sentiment improved in financial markets, after the US and China relaxed their tones and in October we saw a surge, after UK headed for general elections in December. The sentiment surrounding the GBP improved considerably, since odds kept increasing for UK Conservatives winning the elections, which would finally give a direction to Brexit, after more than three years of confusion.
UK Tories won the elections by a clear margin, giving them a strong majority in the UK Parliament, the biggest in decades. This meant Brexit by the end of 2020, which clears some of the uncertainty for businesses in the UK and the GBP. As a result, GBP/USD surged higher in December and ended the year bullish.
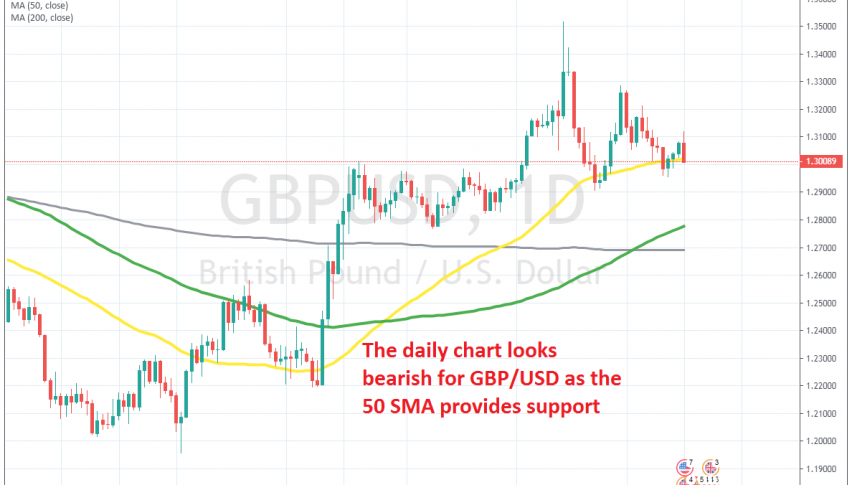
So, many traders might have shifted their bias and have jumped on the northbound train on this pair. The price action of the recent months has been quite bullish, with GBP/USD climbing around 15 cents from the bottom to the top since August/September, as shown on the smaller time-frames, such as the daily above.
.png)
The price has slipped below the 50 SMA again on the monthly chart
But, if we switch to the monthly chart, we can see that the main trend is still bearish. The highs are still getting lower and despite the strong rally at the end of last year, the high in GBP/USD was still lower than in 2018, which means that the pressure is still to the downside on larger time-frames.
Moving averages have been doing a good job in providing resistance during pullbacks higher, particularly the 50 SMA (yellow) and the 100 SMA (green) on the monthly chart and occasionally the 20 SMA (grey) when the price action accelerated to the downside. In December, the price climbed above the 50 SMA, but it retreated lower and has slipped back below it now, which shows that the pressure still remains to the downside.
The UK economy is weakening further, as recent data has been showing, instead of stabilizing, which should keep the GBP bearish for months to come. The Bank of England is also turning quite dovish as their recent comments implied, after being neutral during last year. So, everything is pointing down for this pair and if UK-EU fail to reach a trade deal by the end of this year, then UK will end up with a hard Brexit, which would be detrimental for the GBP.