Selling the Retrace in AUD/USD Below the 50 SMA
AUD/USD has retraced higher after being bearish sine 2020 started, but the retrace seems complete now on the H1 chart
[[AUD/USD]] has turned bearish this month, after being bullish since October. The long term trend which started about two years ago is bearish, but we saw a reversal in October as US and China were heading towards the Phase One deal and the reversal picked up pace towards the end of the year, as year-end cash flows pushed the USD lower.
But, the retrace higher ended as soon as the new year began. The year-end cash flows ended and the USD has turned bullish since then. The increased tensions in the Middle East between US and Iran hurt the sentiment in financial markets and as a result, risk assets such as Commodity Dollars turned bearish.
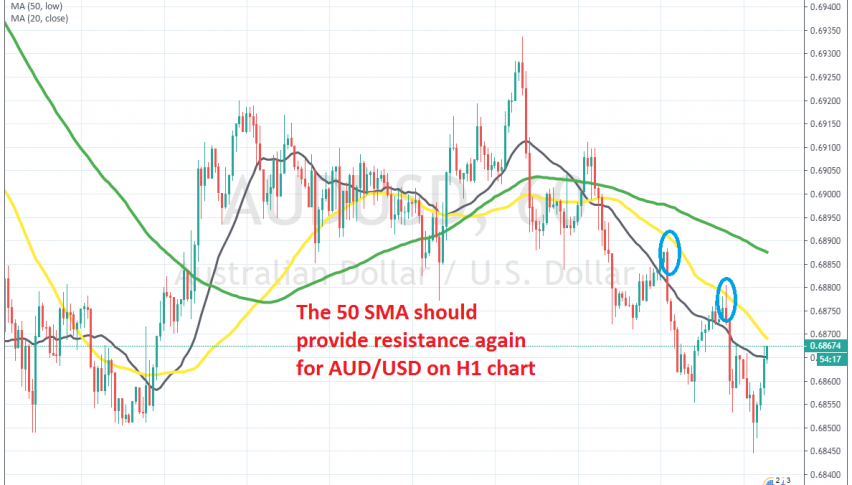
AUD/USD has been declining for three weeks now and moving averages turned from support into resistance on higher time-frame charts as well as on smaller charts. The 50 SMA (yellow) has turned into resistance on the H1 chart in the last few days and right now the price is right below it, after having retraced during the European session today. The retrace is complete on this time-frame now, so we decided to take this opportunity and go short on AUD/USD.
- Check out our free forex signals
- Follow the top economic events on FX Leaders economic calendar
- Trade better, discover more Forex Trading Strategies
- Open a FREE Trading Account
- Read our latest reviews on: Avatrade, Exness, HFM and XM
Related Articles


Sidebar rates
Related Posts
