Watch For MAs to Turn From Resistance Into Support For Bitcoin
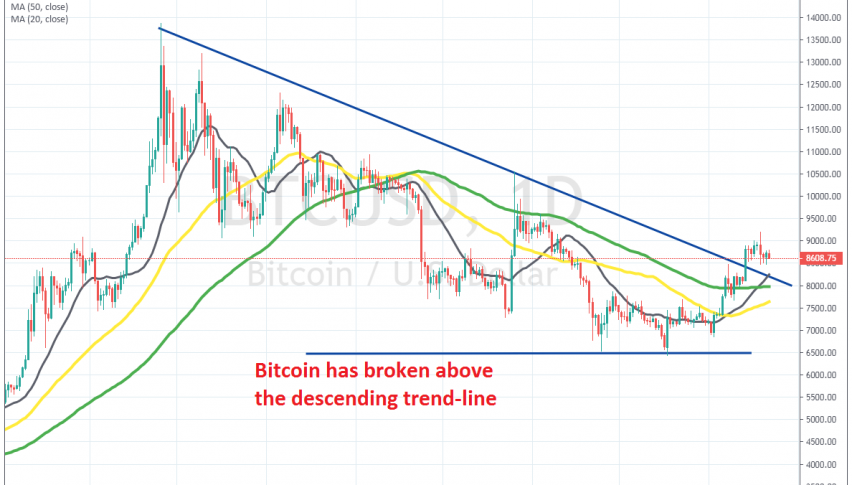
Bitcoin has moved above MAs on the daily chart as it tries to turn bullish. Now lest's see if they will hold as support

Cryptocurrencies turned really bullish in Q2 of this year, after having consolidated in a range, which for BITCOIN ranged from $3,000 to $4,000. The price surged close to $14,000 in Bitcoin, but the climb ended in June and the trend shifted to bearish since then.
Although, if you look back at the chart, or if you look at the weekly or monthly charts, you see that the low is higher than the previous one at the beginning of last year and that is still higher than the previous one. So, the larger trend is still bullish.
In fact, it seems like the bullish trend might have resumed again now, after Bitcoin bounced off the lows at around $6,500, where it formed a support zone. The price has moved above all moving averages on the daily chart now, which is a sign that the buyers are in control and the trend bight be turning bullish again.
Now, let’s see if moving averages and the broken descending trend-line will turn into support from resistance. If they do, since the price has been retreating down for a few days, then that would be a confirmation that the bullish trend is resuming again. We might open a long term buy signal in that case, so follow us for live signals in cryptocurrencies guys.
- Check out our free forex signals
- Follow the top economic events on FX Leaders economic calendar
- Trade better, discover more Forex Trading Strategies
- Open a FREE Trading Account


