Shorting the Retrace in NZD/USD at the 200 SMA
NZD/USD has turned bearish this week and we decided to sell the recent pullback higher, at the 200 SMA on the H4 chart
[[NZD/USD]] has turned bearish this month, after being bullish since October, as the sentiment in financial markets improved due to the Phase One deal prospects. But, the sentiment turned negative this year after the geopolitical tensions between US and Iran, and risk assets such as Commodity Dollars have turned bearish.
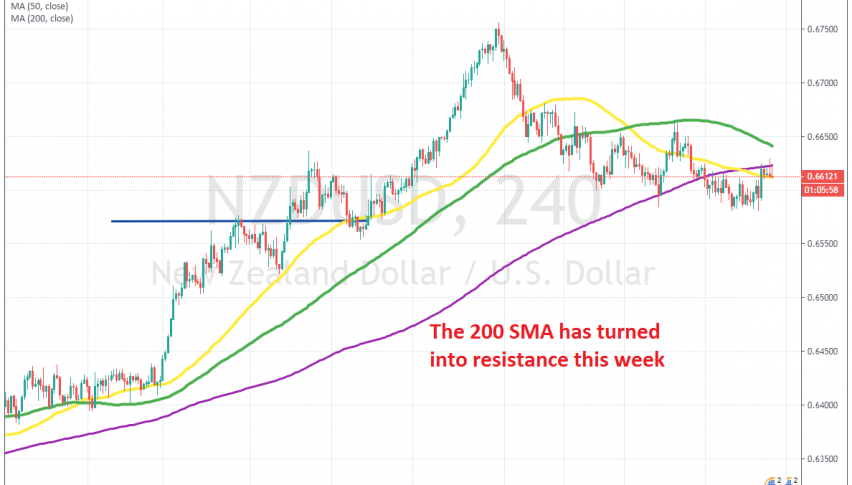
NZD/USD has turned bearish too, losing around 180 pips from the top to the bottom. Moving averages have turned from support into resistance in this pair, with the 50 SMA (yellow) doing so initially. The 100 SMA (green) took up that job last week, after a bounce off thee 200 SMA (purple) on the H4 chart.
But, the price slipped below that last moving average this week and it seems like the 200 SMA is working as resistance now. yesterday we saw a retrace higher after the positive employment report from Australia, which helped the Kiwi as well, but buyers haven’t been able to push above it since then. Now they seem to be getting exhausted and we decided to go short on this pair, considering that it is overbought on this time-frame chart.
- Check out our free forex signals
- Follow the top economic events on FX Leaders economic calendar
- Trade better, discover more Forex Trading Strategies
- Open a FREE Trading Account


