The Retrace in USD/CAD Seems Complete at the 100 SMA
USD/CAD has retraced lower this week, as sentiment improves. But the retrace down is over at the 100 SMA on H4 chart
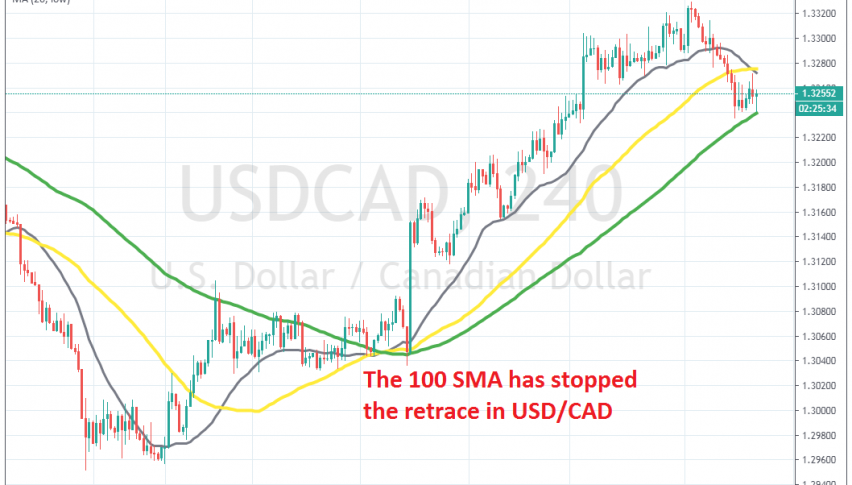
[[USD/CAD]] has been bullish since the beginning of this year, as crude Oil turned bearish, losing more than $16 and pulling the CAD lower with it, hence the uptrend since then. But, OPEC is thinking about cutting production again, this time by 600k barrels, so crude Oil has retraced higher in the last few days.
The CAD has been pulled up from Oil, as well as from the improvement in the sentiment during this week., despite cases of coronavirus increasing exponentially. As a result, USD/CAD has retraced lower this week, breaking below the 20 SMA (grey) and the 50 SMA (yellow).
But, the decline stopped right at the 1200 SMA (green) on the H4 chart. Yesterday, the price reversed higher as the 100 SMA was approaching, but the 50 SMA turned into resistance. Today, sellers had another go at this moving average, but it held again as support and USD/CAD has bounced off of it again. Now, the pullback is complete on this time-frame, so we should see this pair resume the bullish trend. But, the price action in crude Oil will also affect USD/CAD.
- Check out our free forex signals
- Follow the top economic events on FX Leaders economic calendar
- Trade better, discover more Forex Trading Strategies
- Open a FREE Trading Account


