Fundamentals and Technicals Paint A Bearish Picture for EUR/USD
The sentiment improved in financial markets during the Q4 of 2019. The trade war rhetoric between US and China calmed down and they were heading towards a trade deal, which was reached in December, called Phase One deal and which helped improve the sentiment further. The general elections in the UK also helped improve the sentiment, since the UK finally took a direction, out of the EU, clearing a lot of uncertainty.
In recent weeks, the data for December has shown a decent improvement in Britain, especially in the service sector. So, the improved sentiment has been keeping risk assets, such as commodity dollars and stock markets bullish. EUR/USD has also been bullish, partly due to some USD weakness in December last year.
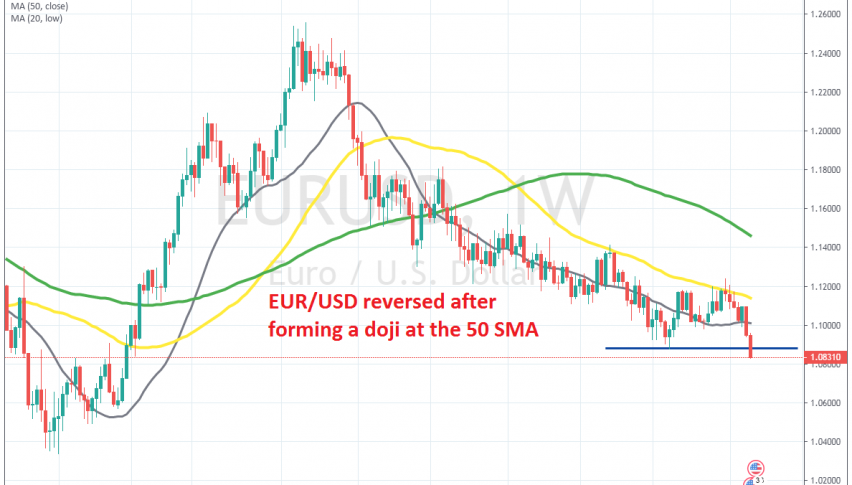
But, it seems like the situation has turned against this pair now. The major trend is bearish for EUR/USD, starting from Q1 of 2018 as shown on the weekly chart above, but if you look at smaller time-frames such as the daily, the picture seemed pretty bullish during the last three months of last year, which made some traders think that the bearish trend might have changed.
But now, several weeks later and those hopes for a reversal have dissipated. EUR/USD failed to break above the 50 SMA on the weekly chart once again, forming a doji candlestick up there which is a reversing signal. EUR/USD reversed from there for the second time last year and it has been bearish since then, resuming the larger downtrend and making new lows. The previous low at 1.0880s was broken, which opens the door for 1.05 now. So, the technical picture looks pretty bearish for EUR/USD.
But things get worse, fundamentals also point down for this pair. The German GDP for Q4 of 2019 fell flat, while the Eurozone economy posted a minimal growth of 0.1%. Manufacturing has improved slightly in recent months, but it remains in deep recession and industrial production continues to decline, as do factory orders. Speaking on manufacturing, it should turn even softer, as the sentiment and the global economy slows down due to coronavirus.
Eurozone GDP Released by Eurostat – 14 February 2020
- Eurozone Q4 GDP second reading +0.1% vs +0.1% q/q prelim
- GDP +0.9% vs +1.0% y/y prelim
German GDP Released by Destatis – 14 February 2020
- Germany Q4 preliminary GDP 0.0% vs +0.1% q/q expected
- Prior (Q3) +0.1%; revised to +0.2%
- GDP non-seasonally adjusted +0.3% vs +0.2% y/y expected
- Prior +1.0%; revised to +1.1%
- GDP working day adjusted +0.4% vs +0.3% y/y expected
- Prior +0.5%; revised to +0.6%
This brings us to the coronavirus epidemic. The virus is in full force in China and it has spread in other countries around the globe. Although it seems to be in control abroad, in China deaths have gone above 1,5k and confirmed cases at 66k, with more than 11k people in critical condition, as the table below shows.
| Country, Territory |
Total Cases |
New Cases |
Total Deaths |
New Deaths |
Total Recovered |
Serious, Critical |
|---|---|---|---|---|---|---|
| China | 66,497 | +2,646 | 1,523 | +143 | 8,489 | 11,053 |
| Japan | 338 | +79 | 1 | 12 | 9 | |
| Singapore | 72 | +5 | 18 | 8 | ||
| Hong Kong | 56 | 1 | 1 | 7 | ||
| Thailand | 34 | +1 | 14 | 2 | ||
| S. Korea | 28 | 9 | ||||
| Malaysia | 21 | +2 | 7 | |||
| Taiwan | 18 | 1 | ||||
| Germany | 16 | 3 | ||||
| Vietnam | 16 | 7 | ||||
| USA | 15 | 3 | ||||
| Australia | 15 | 10 | ||||
| France | 11 | 1 | +1 | 4 | ||
| Macao | 10 | 3 | ||||
| U.K. | 9 | 1 | ||||
| Canada | 8 | 1 | ||||
| U.A.E. | 8 | 3 | 1 | |||
| Philippines | 3 | 1 | 2 | |||
| India | 3 | 3 | ||||
| Italy | 3 | 2 | ||||
| Russia | 2 | 2 | ||||
| Spain | 2 | 2 | ||||
| Sri Lanka | 1 | 1 | ||||
| Finland | 1 | 1 | ||||
| Egypt | 1 | |||||
| Cambodia | 1 | 1 | ||||
| Sweden | 1 | |||||
| Nepal | 1 | 1 | ||||
| Belgium | 1 |
United States Trade Representative announcement late Friday in the US
- Increasing the duty imposed on European aircraft to 15 percent from 10 percent
- Effective March 18


