Daily Brief, Feb 27: Brace for US Prelim GDP – What to Expect From Gold?
On Thursday, the traders are most likely to keep their focus on the U.S. GDP and Durable Goods Orders data, which is due to come out during

Good morning, fellas.
On Thursday, traders are most likely to keep their focus on the US GDP and Durable Goods Orders data, which are due to come out during the New York session today.
A day before, the precious metal gold climbed back to $1,640 an ounce from $1,634 Tuesday as the US dollar remains supported over positive economic data. The US official data showed that new home sales grew to an annualized rate of 764,000 units in January (718,000 units expected).
Later today reports on fourth-quarter GDP (second reading, +2.1% on year expected), January durable goods orders (preliminary reading, -1.5% month on month expected), and initial jobless claims for the week ended February 22 (212,000 expected) will be released.
Recently, broad-based US dollar weakness due to a drop in the US Treasury yields and Wall Street indices also supported gold to regain some footing. Gold is also staying supported as global stocks dropped because the US Center for Disease Control and Prevention said a spread of Covid-19 in the US was sure and warned Americans to be ready for interruptions in their daily lives. Whereas, the European stocks stabilized, as the Stoxx Europe 600 Index closed flat. The UK’s FTSE 100 rose 0.4%, and France’s CAC edged up 0.1%, while Germany’sGermany’s DAX eased a further 0.1%.
Safe have demanded increased further as coronavirus spread fast outside China, with new cases being reported in the US, Singapore, Germany, and several other European countries, as investors are still careful due to looming risks to the global economic growth. Consequently, the US government bond prices remained buoyed, pressing the benchmark 10-year Treasury yield down to a record low of 1.310%.

Gold – XAU/USD – Daily Technical Levels
Support Resistance
1625.61 1655.65
1610.29 1670.37
1580.25 1700.41
Pivot Point 1640.33
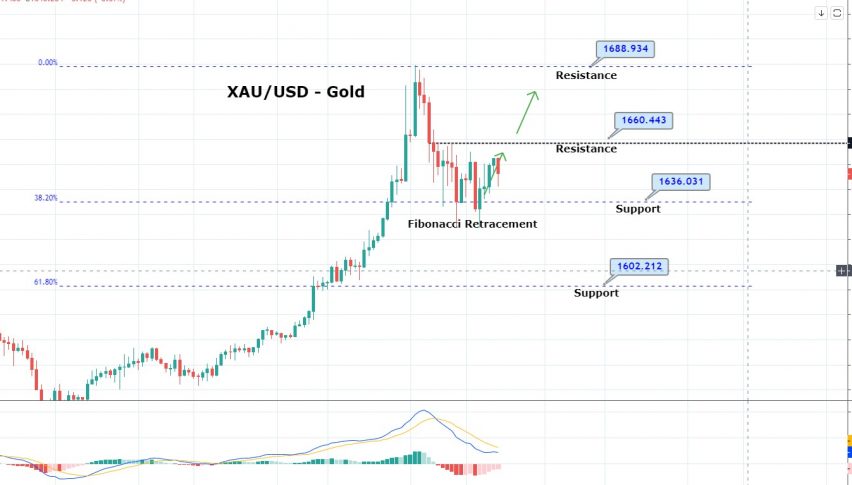
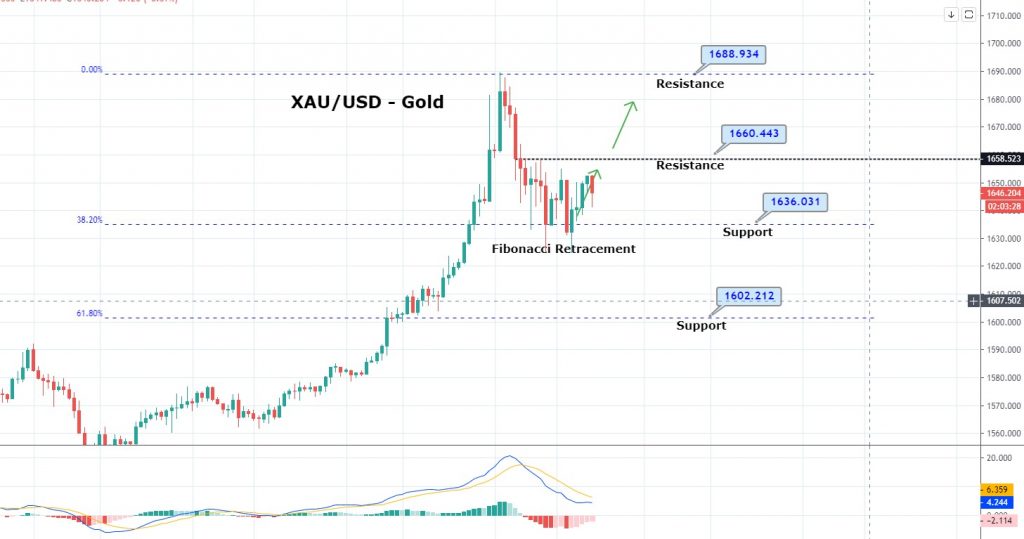
The yellow metal GOLD has traded in a bearish mode in order to fill the massive gap and has almost completed 50% Fibonacci retracement at 1,626 on the daily chart. So far, gold has traded in line with our previous forecast, and we need to stick to the same analysis. A bearish breakout of the 1,626 level can extend gold prices towards 61.8% Fibo level 1,604 in the coming days. On the smaller timeframe, gold has entered into the oversold zone, and it may show us a slight bullish correction until 1,653 before showing more selling.
Good luck, and stay tuned for more updates!
- Check out our free forex signals
- Follow the top economic events on FX Leaders economic calendar
- Trade better, discover more Forex Trading Strategies
- Open a FREE Trading Account


