Daily Brief, Mar 13: Gold Slips Sharply Amid Mixed Risk Sentiments – What’s Next?
The safe-haven-metal prices stopped its 3-day losing streak and rose to $1,588, up 0.70%, mainly due to the fresh risk-reset....
Good morning, traders.
The safe haven metal prices stopped their three-day losing streak and rose to $1,588, up 0.70%, mainly due to the fresh risk-reset. The GOLD prices are consolidating between the gains and losses after the worst stock market day in the US since 1987. At the time of writing, gold is currently trading at $1,590.20 and consolidating in the range between the 1,551.05 – 1,591.10.
Gold futures for April delivery hit a high of $1,584 before falling down 1.81% to $1,561.5 by 9:48 PM ET (1:48 GMT). Due to the broad selling in the stock markets, global investors lost confidence in the yellow metal lately, which in turn led to the three-day losing streak of the bullion. Though, the latest liquidity infusion worth of JPY 700 billion by the Bank of Japan improved the market sentiment for the time being.
After the news, the US 10-year treasury yields recovered 0.80% to 0.84% while the US equity futures also rebounded from the early-day losses to near 3.0% profits each. Moreover, stocks in Asia, as per MSCI’s index of Asia-pacific shares outside Japan, also portray the risk recovery by reversing the early-day losses of more than 5% to 1.36% by the press time.
Apart from Japan’s struggles, comments from the Australian Chief Medical Official and the US House Speaker Nancy Pelosi also gave a little support to the traders. Whereas, the ongoing coronavirus fears continue to remain high because Spain and Italy have suspended some stocks from trading while there will not be any floor trading at the CME from today onwards. Additionally, the global ratings giant Fitch indicated further risks to structured finance.
As per the latest report, the World Health Organization (WHO) declared the COVID-19 novel coronavirus a pandemic on Wednesday. The WHO reported on March 12 that the number of cases has risen to 125,288 with 4,614 deaths. Looking forward, the headlines about coronavirus will be key to watch due to the shortage of releases on the economic calendar.
Daily Support and Resistance
S1 1424.55
S2 1509.41
S3 1542.86
Pivot Point 1594.26
R1 1627.71
R2 1679.12
R3 1763.97
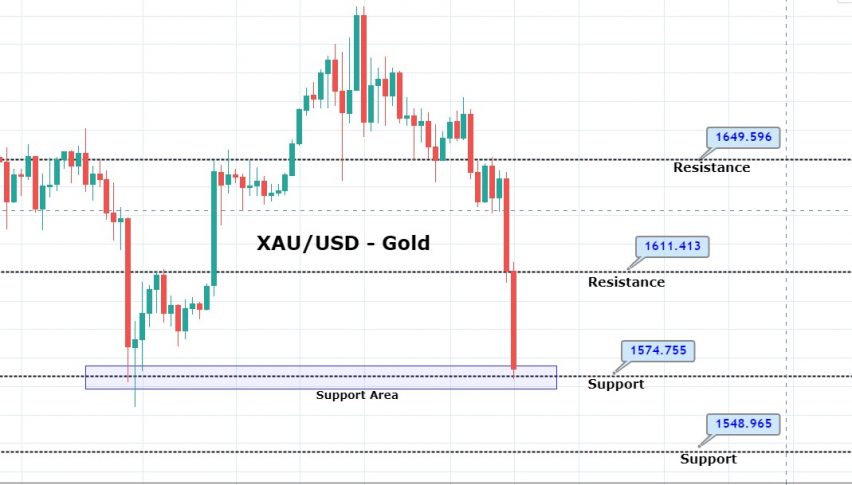
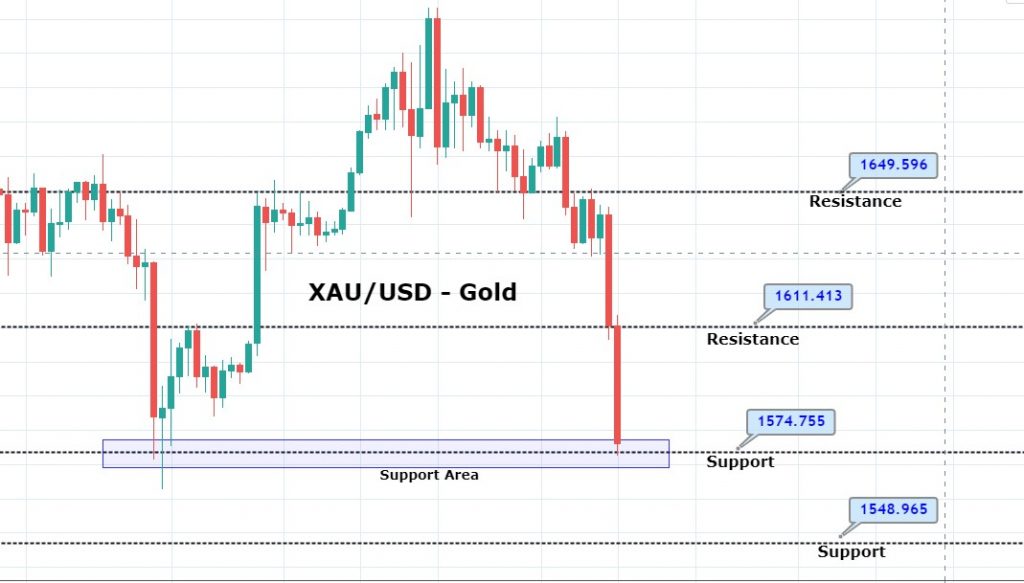
The correlation between gold and stock markets has distorted in the wake of coronavirus threats. Typically gold and stocks move in the opposite direction, but yesterday they both traded in a selling mode. Gold has formed three black crows candlesticks pattern, which is suggesting a strong selling bias among traders. Its immediate support prevails around 1,542 level.
On the 4-hour chart, the closing of bullish engulfing and the RSI in the oversold zone are suggesting odds of a bullish retracement in gold. Therefore, gold prices still have an opportunity to surge up to 1,602 level only if they manage to break above 1,587 resistance today. Good luck!
- Check out our free forex signals
- Follow the top economic events on FX Leaders economic calendar
- Trade better, discover more Forex Trading Strategies
- Open a FREE Trading Account