Bitcoin is Stuck Between the 50 and 100 SMAs on the H4 Chart
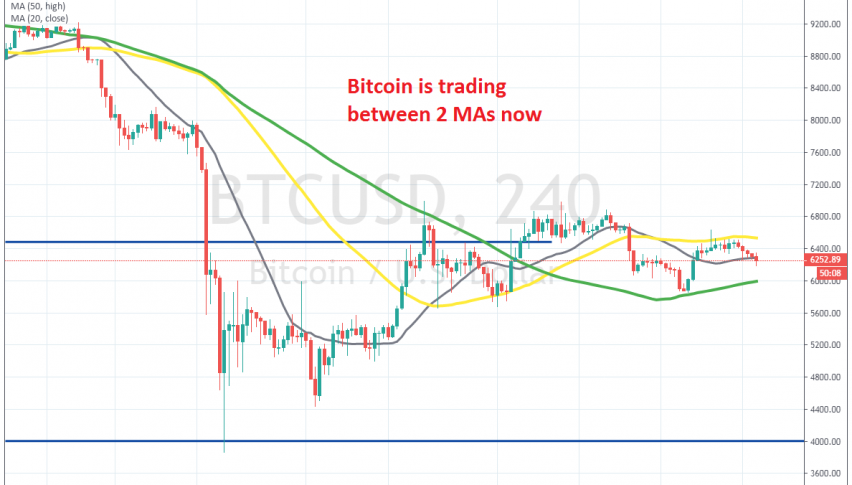
Bitcoin has retraced back up after the crash in early March, but it's stuck between 2 MAs now
BITCOIN started this year on the right foot, as it climbed around $3,500, which was 50% of the value, after starting the year at around $7,000. That followed a bearish trend which lasted throughout the Q3 and Q4 last year. The climb ended at above $10,500 at the middle of February and started to retreat back down.
Although, the retreat looked more like a pullback before the next leg higher. But, coronavirus spread in the West and the panic hit financial markets. Bitcoin made a steep decline, falling below $4,000, which is more than $6,500 since the top about a month ago.
The logic tells you that traders would turn into cryptocurrencies after the turmoil in the forex market, following the massive stimulus programmes from all governments and central banks due to coronavirus. But, the logic was simple in this case – if the world order collapses, then no one is going to need cryptocurrencies. Or they might, who knows how it might go, but the fact is that traders sold Bitcoin.
Although, it retraced up again and has been trading between the 50 SMA (yellow) and the 100 SMA (green) on the H4 chart. They have switched places now, but they are doing the same job, keeping Bitcoin confined. Let’s see in which direction the break will be.
- Check out our free forex signals
- Follow the top economic events on FX Leaders economic calendar
- Trade better, discover more Forex Trading Strategies
- Open a FREE Trading Account
- Read our latest reviews on: Avatrade, Exness, HFM and XM
Related Articles

Sidebar rates
Related Posts
