Shorting EUR/USD at the Descending Trend Line
EUR/USD has been retracing higher this week, but the retrace seems complete now at the 100 SMA
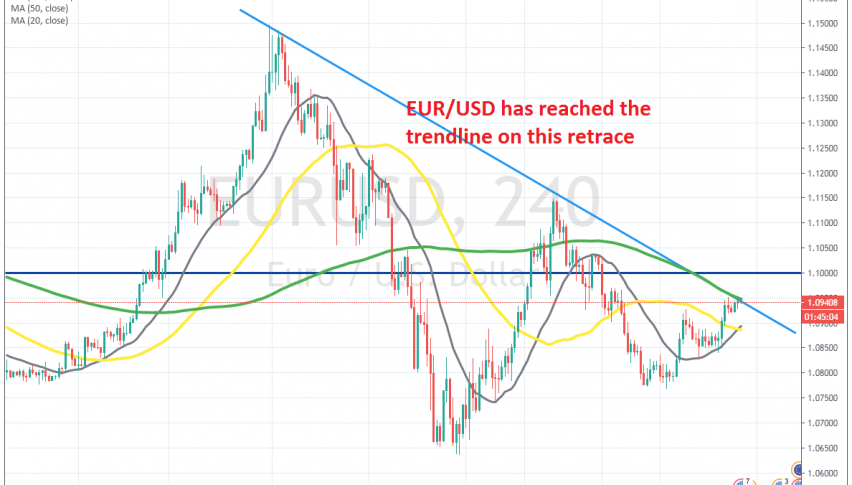
This week, EUR/USD has been bullish, climbing from around 1.0770s to 1.0940s. But, the main trend is still bearish. As shown on the H4 chart above, the highs are getting lower in this pair, first it was at 1.15 at the beginning of March, then the second pullback took this pair to 1.1150 and now EUR/USD has climbed to 1.0940s.
The price is overbought on this time-frame chart, so the pullback on this chart seems complete now. Besides, the 100 smooth moving average (green) is providing resistance now, stopping buyers from pushing higher. So, this chart setup points to a bearish reversal soon.
On top of that, the descending trend line, connecting the previous two highs, comes right at this level where the 100 SMA stands, which should add some extra strength to this resistance area. So, we decided to open a sell signal on this pair and now we are waiting for the reversal to come.
- Check out our free forex signals
- Follow the top economic events on FX Leaders economic calendar
- Trade better, discover more Forex Trading Strategies
- Open a FREE Trading Account


