EUR/USD Reverses Down at the 100 SMA, But Faces the 50 SMA Now
EUR/USD tried to turn bullish today, but the 100 SMA stopped the climb and this pair has turned bearish again from there
[[EUR/USD]] turned bullish in the first two weeks of this year, climbing around 200 pips from the bottom to the top. During that period, moving averages like the 50 SMA (yellow) have turned into support, holding the declines and sending this forex pair higher.
During the climb, other moving averages like the 100 simple MA (green) provided resistance. The 100 SMA stopped the climb once in the first week but the buying pressure was strong enough to push this pair above the 100 SMA and EUR/USD got pretty close to 1.10.
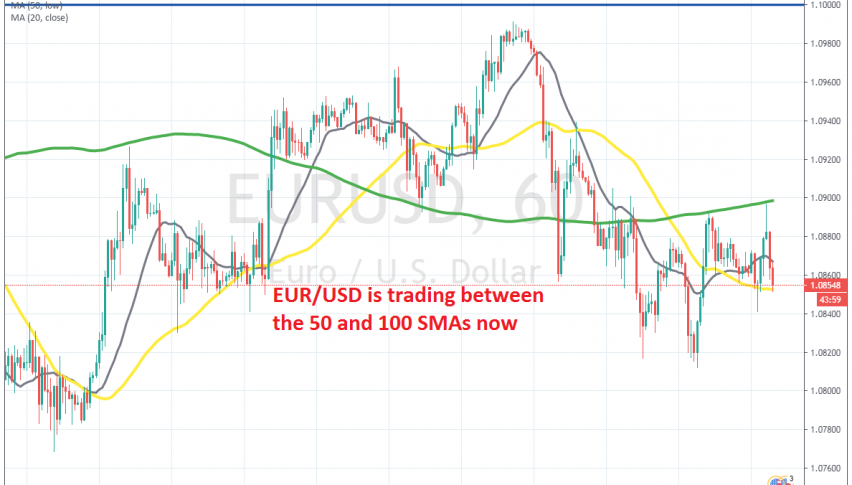
But, EUR/USD pulled back down from that big round level and it has been declining since then. The price slipped below the 100 SMA and this moving average turned into support again. Last Friday, EUR/USD tried the 100 SMA but that moving average rejected the price and it did so once again today.
EUR/USD has lost nearly 50 pips but it is now facing the 50 SMA (yellow) on the H1 chart which is providing support. So, now the 50 SMA is stuck between two moving averages and will probably remain there today, since the economic data is very light today in the US session.
- Check out our free forex signals
- Follow the top economic events on FX Leaders economic calendar
- Trade better, discover more Forex Trading Strategies
- Open a FREE Trading Account


