When the Downtrend is Strong in Oil, Switch to Smaller Period Charts


Crude Oil has absolutely crashed down in the last two months or so. It first crashed down during early march, after Russia and Saudi Arabia went into a price war, with Saudis flooding markets with cheap Oil. As a result, US WTI crude fell below $20 at the end of March.
The OPEC+ deal to cut production by a massive 9.7 million barrels/day improved the sentiment surrounding Oil for a while, sending it to $29. But, that wasn’t enough to keep it up and Crude Oil turned bearish again. Saudi Arabia resumed flooding markets with cheap Oil, despite the OPEC+ deal, which seems fishy to me, and WTI crashed down below $20 again, falling to $12.50 yesterday.
US Crude Oil futures have gone deep in negative territory, with US Oil producers paying nearly $40/barrel to get rid of their possessions. This is another fishy thing in all this situation. Is the world shifting to a new source of energy and we don’t know yet? Because that would explain the dumping of Oil by everyone.
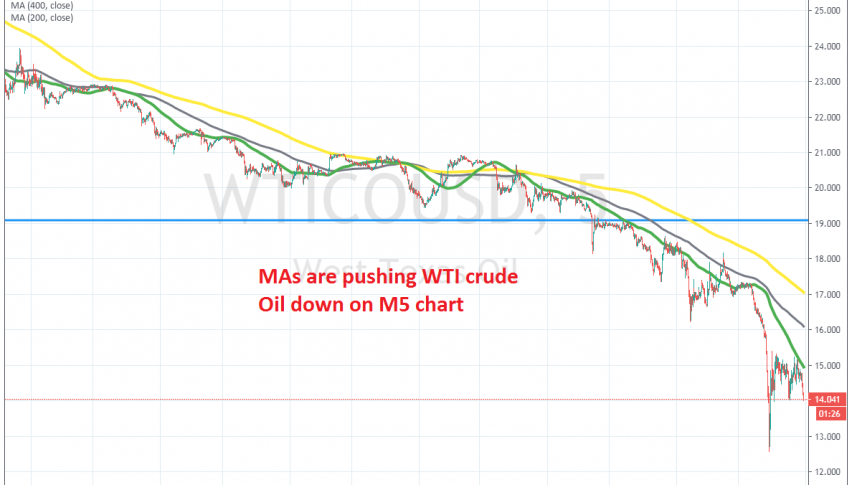
Anyway, the larger time-frame charts don’t really work now, so it’s better to switch to smaller period charts to look for pullbacks higher in order to go short. Moving averages have been good indicators in predicting the end of the pullbacks/consolidation before the next move lower.
That’s on the 5 minute chart. We missed a good opportunity to sell at the 100 SMA (green) earlier on when WTI crude was trading at $15.30s. Now it’s 130 pips lower. Anyway, that’s the plan – wait for moving averages to catch up and sell.