Is the Trend Changing for EUR/CHF Now?
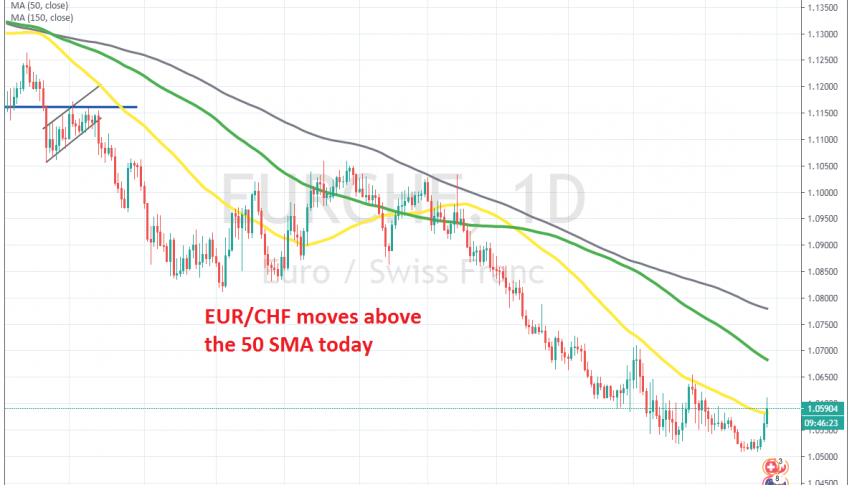
EUR/CHF has finally climbed above the 50 SMA on the daily chart for the first time this year

EUR/CHF has been trading on a bearish trend exactly for two years now, since it reversed down right at 1.20 in April 2018. Since then, the traffic has been in one direction only for this pair and the price fell pretty close to 1.05 last week, as seen in the daily chart above.
During this time, moving averages have been doing a great job providing resistance during pullbacks higher and reversing the price down. The 200 SMA (grey) reversed this pair down a couple of times at the end of last year, and then the 50 SMA (yellow) took over as the downtrend picked up pace.
The price formed two doji candlesticks on the daily chart below the 50 SMA in late February and late March, which are bearish reversing signals after the pullback. But now, EUR/CHF has climbed above the 50 SMA, as the CHF turns bearish, while the Euro is moving higher.
So, this chart setup tells us that EUR/CHF will probably move higher to the 100 SMA (green) or to the 200 SMA (grey), unless sellers return today and push the price down, below the 50 SMA. That would be a really strong bearish signal, but I don’t think that will happen. This might actually be the SNB (Swiss National Bank) intervening in the markets to weaken the CHF. Although, the main trend remains bearish, so when it reaches one of the MAs above, we will look to sell this pair.
- Check out our free forex signals
- Follow the top economic events on FX Leaders economic calendar
- Trade better, discover more Forex Trading Strategies
- Open a FREE Trading Account


