Gold Now Should Head to the 50 SMA, After the 20 SMA Was Broken
Gold the 20 SMA was keeping Gold up recently, but that moving average was broken yesterday and now Gold is headed lower
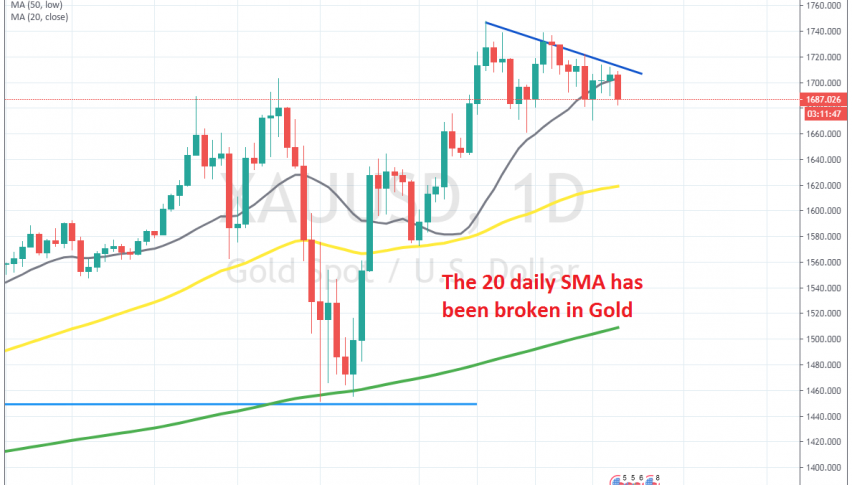
GOLD has been pretty bullish this year, as the 20 SMA (grey) was pushing the price higher in the daily chart. In late February, we saw a surge to $,1700 but then the price pulled back down. But the 50 SMA (yellow) provided some solid support on the daily chart.
Gold climbed above $1,700 for a short while, but then reversed down, as the USD surged due to the coronavirus panic, losing around $250. But this time, the 100 SMA (green) turned into support for Gold, aided by the support level at $1,450, both of which did a great job in stopping that crash.
Then came the massive bullish reversal by the middle of March. Gold surged to $1,750, after finding support at the 50 SMA once again and closed a pretty bullish month in April. But, Gold has been forming some lower highs, which means that the buying pressure is declining. The 20 SMA was holding as support for some time, but yesterday Gold formed a strong bearish candlestick, which was a clear break of that moving average.
This doesn’t mean that the trend has been broken, but rather that a pullback is taking place until the next bullish move starts. Sellers might push to the 50 SMA, but the price action is pretty slow, compared to earlier months and the lockdown continues, so we’ll see how far lower they will be able to push.
- Check out our free forex signals
- Follow the top economic events on FX Leaders economic calendar
- Trade better, discover more Forex Trading Strategies
- Open a FREE Trading Account