AUD/USD Stuck Between 2 MAs on the Daily Chart
The 100 daily SMA rejected AUD/USD last week, but the 20 SMA held well as support to the downside
[[AUD/USD]] turned bearish as soon as this year began, after climbing higher in Q4 of last year. But, the big crash came during the first half of March, as the coronavirus flu broke out in Europe and in the US, sparking panic in financial markets, which sent risk assets lower.
The USD also turned really bullish, since the USD is the world reserve currency. As a result, AUD/USD dived around 12 cents lower in the first half of March. But, the reversal back up was quite as quick. AUD/USD climbed more than 10 cents from the middle of March to the end of April.
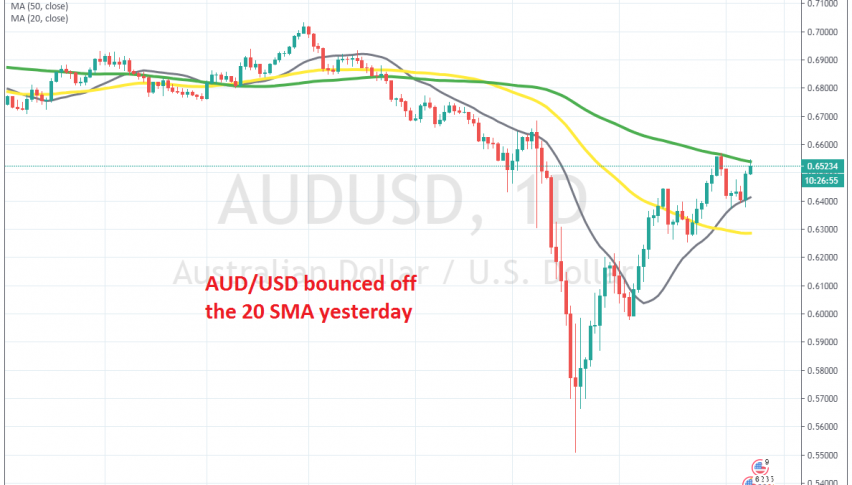
But, the 100 SMA (green) stopped the climb and this pair reversed back down at the end of last week. But, the decline ended at the 20 SMA (grey) on the daily chart. That moving average was holing well as support, but it was pierced to the downside today. Although, the price reversed back up and surged higher, as the USD declined. So, the piercing earlier today doesn’t count as a break.
Now, AUD/USD remains stuck between the 20 SMA at the bottom and the 100 SMA at the top. Whichever side this pair breaks out, that will be the next move for some time to come, although the upside is more at risk, since Australia is not that affected by coronavirus, while the FED is thinking about throwing more money at the economy.
- Check out our free forex signals
- Follow the top economic events on FX Leaders economic calendar
- Trade better, discover more Forex Trading Strategies
- Open a FREE Trading Account


