NZD/USD Forms a Bullish Reversal Pattern at the Support Level
NZD/USD retreated lower after the RBNZ meeting last night, but is reversing back up now from the support at 0.66
Yesterday we opened a buy forex signal in NZD/USD , after this pair retraced lower to the 100 SMA (green) on the H4 chart. That moving average provided support and this pair bounced higher during the European session, so we booked profit on that signal.
Then the price started to reverse down as the USD was gaining strength. We decided to place a buy pending order at the 100 SMA again, which stood at 0.6050, hoping that this moving average would hold on once again and reverse NZD/USD up.
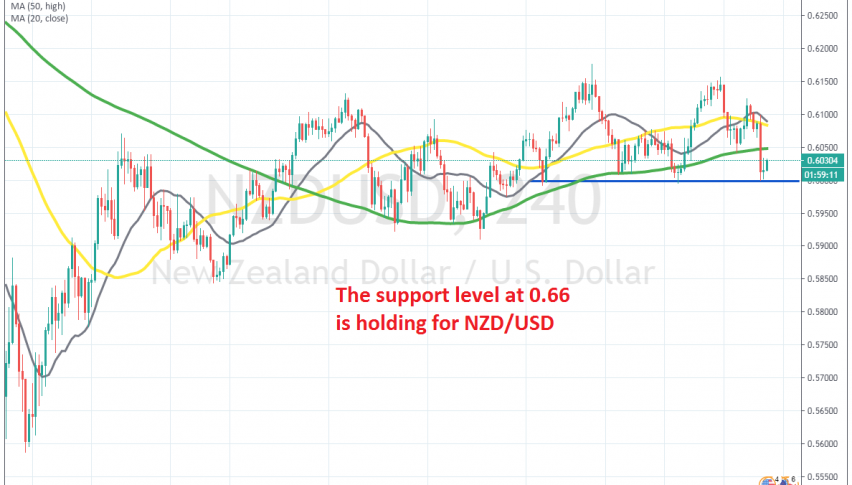
But, the pullback lower was deeper. NZD/USD broke below the 100 SMA as the USD attracted some more bids overnight, while the Reserve Bank of New Zealand held its meeting. It appears that the RBNZ statement was tilted to the dovish side, which is normal right now, although not as dovish as other major central banks, since New Zealand was largely untouched from coronavirus pandemic.
So, the decline stopped right at 0.66 for this pair and it started reversing higher during late Asian session. The price formed a doji candlestick as well, which is a bullish reversing signal after the decline and the current candlestick looks bullish, so the decline is over for this pair and now NZD/USD is heading higher. We will try to go long here, although we will wait for a slight retrace lower before buying.
- Check out our free forex signals
- Follow the top economic events on FX Leaders economic calendar
- Trade better, discover more Forex Trading Strategies
- Open a FREE Trading Account


