GBP/USD Banging its Head Against the 50 Daily SMA
GBP/USD has retraced higher in the last few days, but the 50 SMA is stopping it now
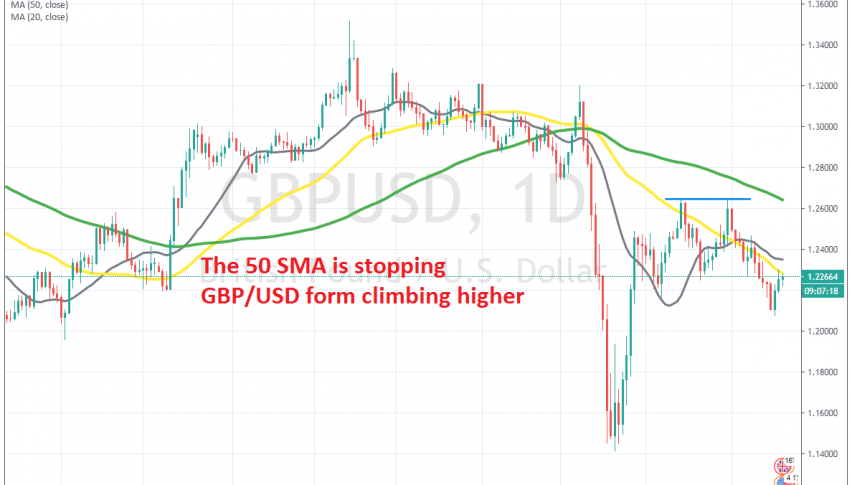
[[GBP/USD]] went through a major decline after the outbreak of coronavirus in Europe by the middle of March. This pair crashed 18 cents lower in a little more than a week, falling from 1.32 to 1.14. But, the reversal up was quite as strong, but it did not last long enough to claim back all the losses.
Instead, the climb stopped at 1.2650s, from where it reversed down twice. So a double top formed for GBP/USD up there and according to the forex textbook, this pattern should take GBP/USD to 1.1850s. But, this week the USD turned bearish, so GBP/USD has been retracing higher.
Although, the pullback higher has stopped right at the 50 SMA (yellow) on the daily chart. This moving average has been acting as resistance in the last two days, so buyers will have to push above it if they want the bullish momentum of this week to continue. If not, then the bearish trend will resume again and the double top pattern will probably play out and the price will fall to 1.1850s. So, we will have to see if the 50 SMA breaks soon. If not, then we might go short on this pair.
- Check out our free forex signals
- Follow the top economic events on FX Leaders economic calendar
- Trade better, discover more Forex Trading Strategies
- Open a FREE Trading Account
- Read our latest reviews on: Avatrade, Exness, HFM and XM
Related Articles


Sidebar rates
Related Posts
