EUR/CHF Stuck Between 2 MAs on the Daily Chart
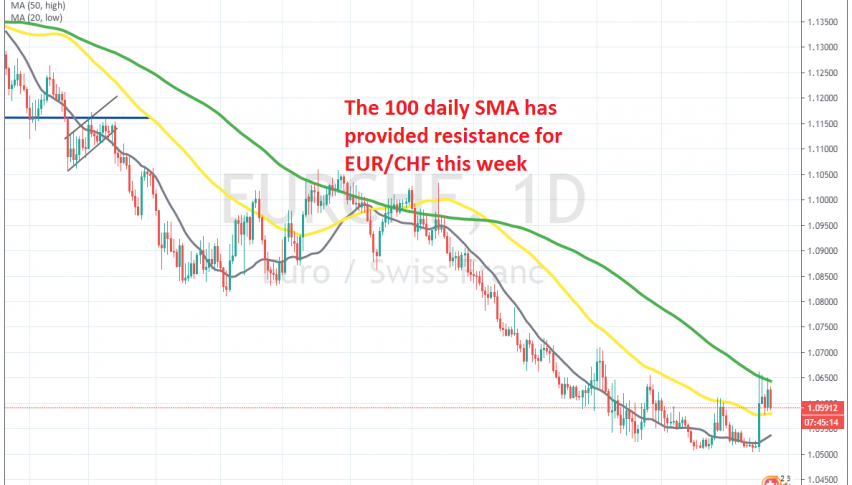
EUR/CHF retraced higher on Monday, but the retrace ended at the 100 daily SMA
EUR/CHF has been trading on a bearish trend since April 2018, when it reversed at 1.20. That level used to be the threshold for the SNB (Swiss National Bank) until 2015, when the SNB removed the CHF peg to the Euro and the forex market went crazy back then, with many people losing their accounts.
During the decline, moving averages have been doing a good job in providing resistance during pullbacks higher on the daily chart. Smaller moving averages such as the 20 SMA (grey) and the 50 SMA (yellow) have pushed EUR/CHF lower when the trend was strong, while larger MAs such as the 100 SMA (green) took up that job when buyers became more eager on stronger retraces higher.
The 20 SMA was pushing this pair lower during the first couple of months of 2020, but that moving average was broken towards the end of February. The price moved above it, but the 50 SMA (yellow) turned into resistance for the next two months. The 50 SMA was broken on Monday but then the 100 SMA took its place, reversing this pair back down.
So, EUR/CHF has been finding resistance at the 100 SMA all week, while the 50 SMA has now turned into support for this pair. A battle has been going on all week, but I think that sellers have the upper hand still, with the trend still being bearish and the sentiment remaining negative in financial markets, which is keeping safe havens such as Gold and the CHF supported.
- Check out our free forex signals
- Follow the top economic events on FX Leaders economic calendar
- Trade better, discover more Forex Trading Strategies
- Open a FREE Trading Account
- Read our latest reviews on: Avatrade, Exness, HFM and XM