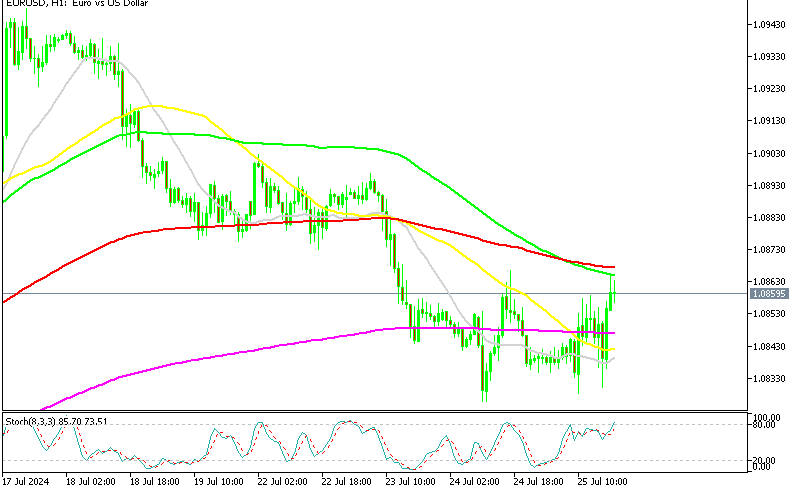
EUR/USD Bounces Off the 20 SMA, Heading for the Highs
[[EUR/USD]] has been trading on a bearish trend for about two years now, after it failed to hold above 1.25 early in 2018. Although, we saw a major comeback in late February and early March as the coronavirus broke out in Europe and the US, sending this pair more than 7 cents higher.
But, the surge stopped right at 1.15 and the reversal back down was just as ferocious. In fact, it took this pair even lower to 1.0630s. In the last week of March, we saw another bullish move higher, but this time the climb ended at 1.1150s and reversed back down again.
In the last two months, EUR/USD hasn’t been able to move above moving averages, so buyers have given up on their hopes to turn this pair bearish again. The 50 SMA (yellow) and the 100 SMA (green) turned into resistance during the last two months, while now it seems like the 20 SMA (grey) turned into support for EUR/USD. Yesterday the 20 SMA held the delcine and a doji daily candlestick formed, which is a bullish reversing signal.
Today the price action looks pretty bullish and now we are heading for the 100 SMA again on the daily chart. That moving average comes in at around 1.10, which is a big round level in itself. So, if we see buyers hesitating up there and a bearish reversing signal forms, then we might be persuaded to open a sell forex signal. But first, let’s wait and see if EUR/USD will reach the 100 SMA.


