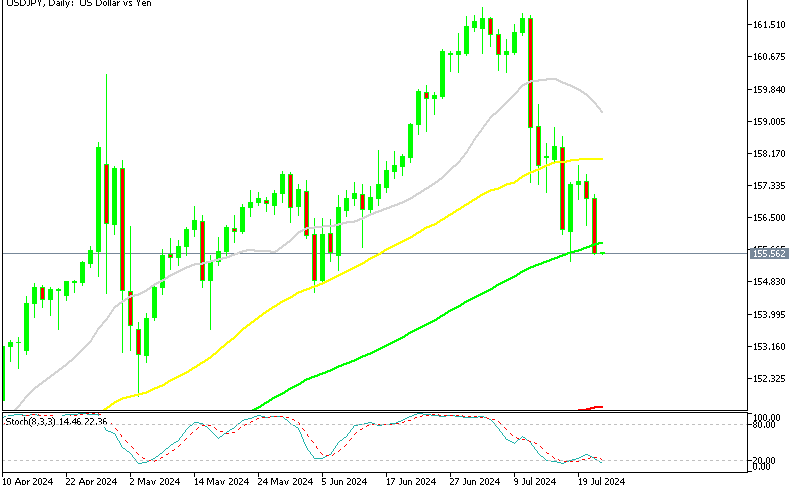
Over the past several weeks, one of the bright spots for the Greenback has been versus the yen. The first two forex trading days of June have reinforced this trend ― the USD/JPY is up by more than 100 pips. Is this the beginning of a bull run toward the COVID-19 highs (112.22)? From a technical standpoint, a prolonged uptrend may be setting up for the USD/JPY.
One of the great things about active trading is that slow market conditions rarely last. Wednesday brings a full economic calendar and a probable spike in participation. The latest ISM releases, EIA Crude Oil Stocks, and the ADP Employment Report are all due out. If nothing else, these figures will draw bids and asks from institutional players around the globe.
Let’s take a look at the weekly technicals for the USD/JPY and see if there’s a trade to be had.
USD/JPY Breaks Above Weekly Resistance
Safe-haven performance has lagged today, with the yen, Swiss franc, and gold all falling against the USD. While the Greenback is well off of its March highs, investors appear to be in no hurry to stockpile the safe-havens.
+2020_23+(11_14_52+AM).png)
For the time being, the USD/JPY has broken above weekly resistance. These levels are now support and may offer a buying opportunity on a pullback:
- Support(1): Bollinger MP, 108.34
- Support(2): Daily SMA, 107.59
Bottom Line: In the event we see a retracement toward the 108.00 handle, a long trade setup may come into play. For the remainder of the week, I’ll have buy orders in the queue from 108.35. With an initial stop loss at 107.94, this trade produces 25 pips on a sub-1:1 risk vs reward ratio.


