Crude Oil Falls Below the 50 SMA, Now Faces the 100 SMA


The two month period from February to April was quite horrible for crude Oil, as prices kept declining due to the global lock-down and the Saudis flooding markets with cheap Oil, which sent US WTI crude to -$37. But, since mid April, crude oil has been climbing higher.
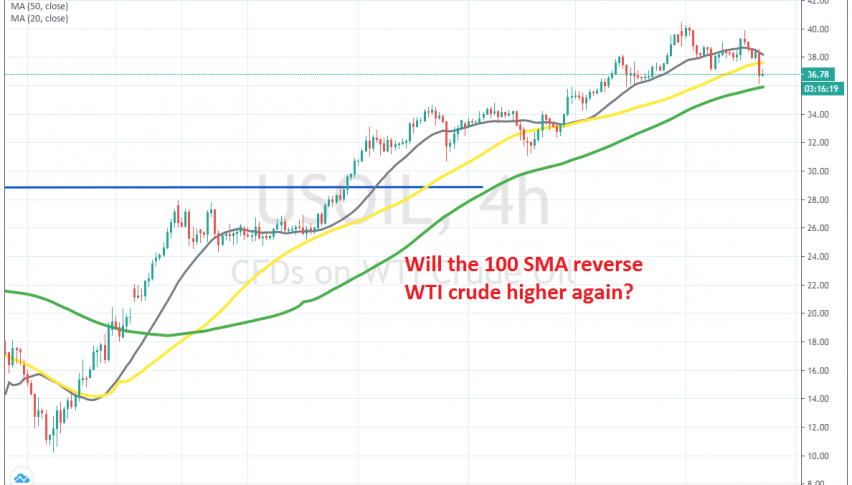
During this time, moving averages turned into support, afte the price climbed above them. Crude Oil has been leaning on the 50 SMA (yellow) and the 20 SMA (grey) during the last two months and at the end of last week, US WTI crude Oil climbed above $40/barrel.
But the price pulled back lower and US Oil fell below the 20 SMA. Buyers had another attempt at the top side, but they didn’t make new highs. The price formed an upside-down hammer which is a bearish reversing signal Oil retraced lower. Now, the 50 SMA has ben broken but sellers are facing the 100 SMA on the H4 chart. If Oil forms a bullish reversing signal at the 100 SMA, then we might go long on Oil, so follow our live signals page for trade ideas.