Buying the Pullback in Oil at the 100 SMA
Crude Oil has retraced lower, but the trend is bullish so we decided to buy this pullback
The situation changed dramatically for Crude Oil – from February until mid April it was crashing down. Then it turned bullish from -$37 for the next two months and climbed above $40 earlier this week. The break of the $40 level was a psychological barrier overcome, since the crash in Oil began at $40 and the decline continued until near -$40.
US WTI crude retreated from there but found support at the 50 SMA (yellow) once again, which had done that job before on the H4 chart. Sellers had a couple of attempts at breaking below that moving average, but after failing for the second time, Oil bounced higher.
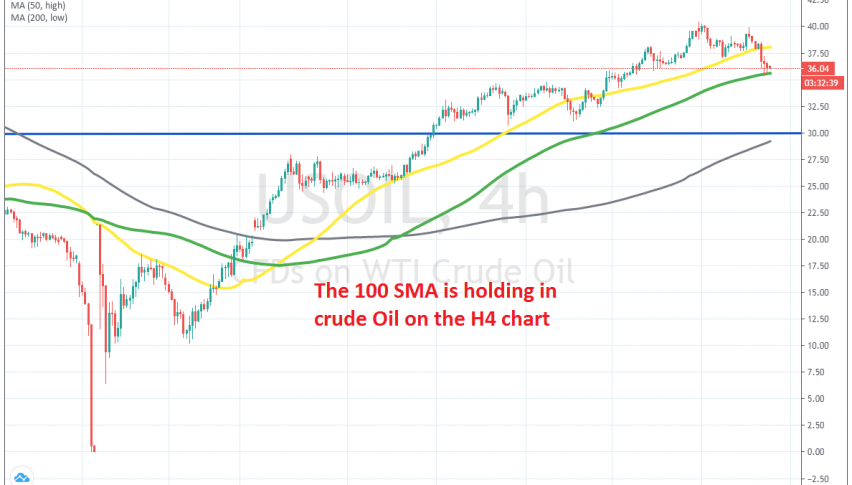
Although, this time Crude Oil didn’t make new highs and it didn’t even move above $40, which was a sign that a decent pullback was underway. Another bearish reversing sign was the upside-down hammer candlestick just below $40. So, the retrace unfolded and WTI crude reached $35.40.
But, the 100 SMA (green) held as support during two attempts, which we took as a bullish signal, similar to the bearish one at $40. The two candlesticks also pointed to a bullish reversal in Oil,so we decide to go long at $36.04 with a stop at $34.90 and take profit target below the 50 SMA at $37.50. That signal got smoked after Oil pierced below the 100 SMA. But we opened another buy signal down close to $35, so now we are more than 100 pips in profit with this trade.
- Check out our free forex signals
- Follow the top economic events on FX Leaders economic calendar
- Trade better, discover more Forex Trading Strategies
- Open a FREE Trading Account
- Read our latest reviews on: Avatrade, Exness, HFM and XM
Related Articles


Sidebar rates
Related Posts
