EUR/JPY Bouncing Between 2 MAs
EUR/JPY has reversed back down from the 50 SMA, so the range trading continues
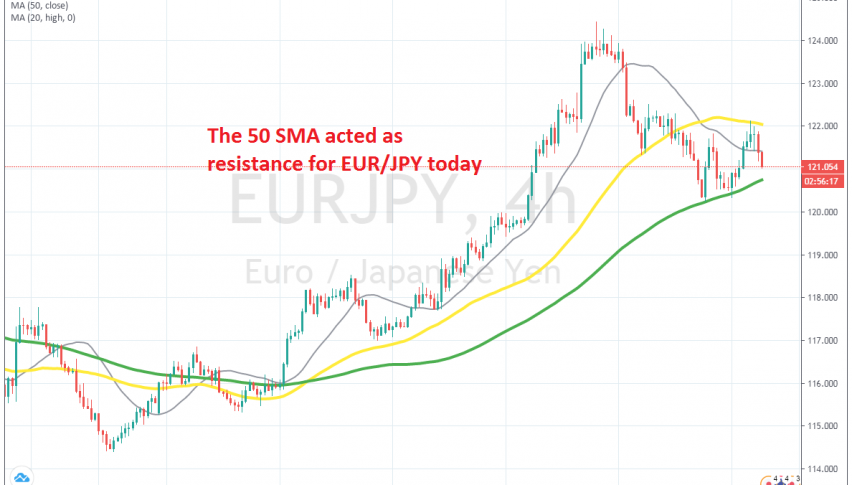
EUR/JPY has been really bullish during the last month or so, since it reversed higher by the middle of May. As a result, this pair has gained nearly 10 cents from the bottom up to the top, which was put in place in the first week of this month, as this pair climbed to 124.40s.
But, in the last two weeks, EUR/JPY has retreated lower, giving back around 4 cents. The price was finding some support at the 50 SMA early last week, but that moving average was broken and the price continued lower until the 100 SMA (green) on the H4 chart.
This moving average held in the first attempt and the price bounced higher. It returned back down at the 100 SMA again at the end of last week, but yesterday we saw another bounce from there and EUR/JPY reached the 50 SMA, which also rejected it.
After a doji candlestick which is a bearish reversing signal, EUR/JPY headed lower and is eyeing the 100 SMA again now. Let’s see if this moving average will hold the decline again. If we get a bullish reversing signal down there, then we might open a buy forex signal, targeting the 50 SMA, with a stop below the 100 SMA.
- Check out our free forex signals
- Follow the top economic events on FX Leaders economic calendar
- Trade better, discover more Forex Trading Strategies
- Open a FREE Trading Account


