NZD/USD Reverses Down From the 50 SMA, as the USD Jumps Higher
NZD/USD has retreated back down after another retest of the 50 SMA
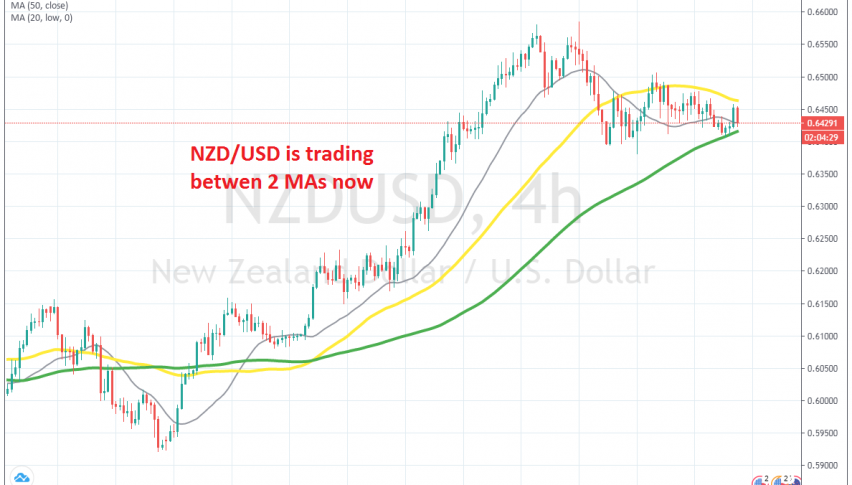
A while ago we saw a quick decline in the USD, which sent some forex pairs around 50 pips higher. I didn’t se any reason for that pop, which sent EUR/USD to 1.1250s and NZD/USD higher to the 50 SMA (yellow) on the H4 chart, which had bounced off the 100 SMA (green) earlier.
But, the bullish move faded pretty quickly and EUR/USD declined nearly 90 pips lower, while NZD/USD recersed down at the 50 SMA. This moving average has been providing resistance for this pair since last week and it did so again today, which is a sign that the trend might be turning bearish now, after climbing higher for more than 2 months.
The weekly chart also points to a bearish reversal in the long term, since the price reversed last week at the 100 SMA, which is a long term resistance indicator for this pair. Although, now sellers will have to push below the 100 SMA on the H4 chart, which acted as support. If they do, then that would be a sign that the bearish trend is officially on. Although, I don’t think I will sell the breakout right away, but rather wait for a pullback and a retest of the 100 SMA.
- Check out our free forex signals
- Follow the top economic events on FX Leaders economic calendar
- Trade better, discover more Forex Trading Strategies
- Open a FREE Trading Account


