US Oil Makes A Bullish Reversing Pattern at the 100 SMA
Crude Oil fell more than $4, but the 100 SMA held as support and the price bounced higher from there
Crude Oil has ben really bullish since it came back from the dead, back at the middle of April. US WTI crude fell to -$37.50 back then, as Saudis kept flooding markets with cheap Oil, despite signing the agreement with OPEC+ to reduce Oil production and export.
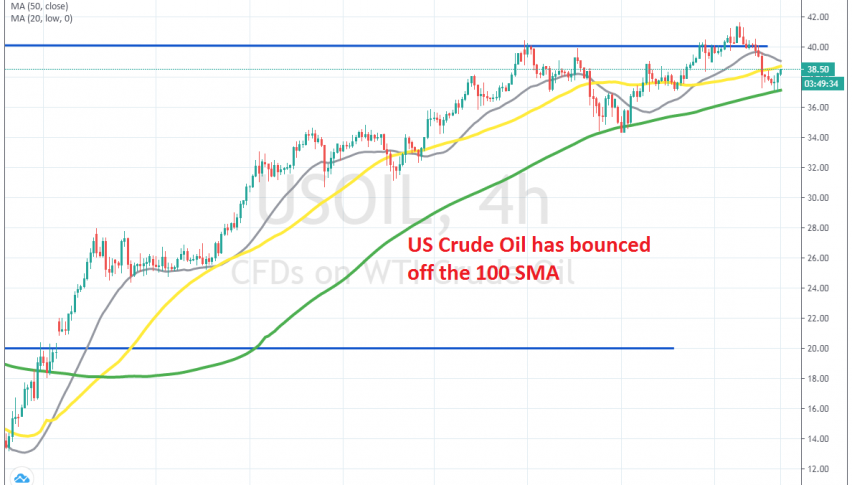
But, the world didn’t end due to the lock-downs and the US Oil industry didn’t collapse, so Oil turned higher back then and has been climbing up since then, moving from around -$40 to above $40. We saw a decent pullback form the $40 level earlier this month, but the 100 SMA (green) held well as support and US Oil bounced higher from it.
The price reached $41.60s, as shown in the H4 chart above, but yesterday we saw another strong bearish reversal. Crude Oil fell more than $4.5 cents as coronavirus cases increased in the US, or so they show. But the 100 SMA is acting as support again. The price formed a doji candlestick above the 100 SMA, which is a bullish reversing signal after the decline and the following two candlesticks already look pretty bullish.
Now crude Oil is around 150 pips higher. That was a good opportunity to buy crude Oil, but we missed it since the reversal took place early in the morning. Although, we will see if the 100 SMA holds and Oil forms another bullish reversing pattern at the 100 SMA, if the price retraces back down there.
- Check out our free forex signals
- Follow the top economic events on FX Leaders economic calendar
- Trade better, discover more Forex Trading Strategies
- Open a FREE Trading Account


