Trying GBP/USD Shorts Again at the 50 SMA
GBP/USD retraced higher yesterday, but the pullback ended at the 50 SMA
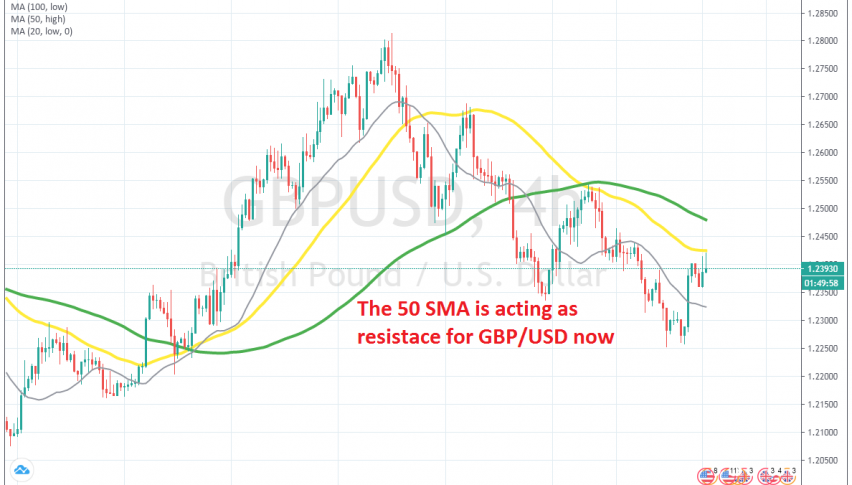
[[GBP/USD]] used to be pretty bullish from the middle of May until the middle of June, as the USD went through a weak period. As a result, this forex pair climbed nearly 8 cents, while it was being supported by the 20 SMA (grey)on the H4 time-frame chart.
But the climb ended above 1.28 and GBP/USD turned bearish after that. The price reversed back down and he 100 SMA (green) provided support once, while the 50 SMA (yellow) turned into resistance. The highs have been getting lower, so the trend has shifted on this time-frame.
The 50 SMA acted as resistance twice in June, once in the middle of the month and once towards the end of it. Yesterday we saw another decent pullback, which took this pair around 150 pips higher, but it seems like the pullback ended right at the 50 SMA once again. We just opened a sell forex signal there, so now we are well in profit with that trade.
- Check out our free forex signals
- Follow the top economic events on FX Leaders economic calendar
- Trade better, discover more Forex Trading Strategies
- Open a FREE Trading Account


