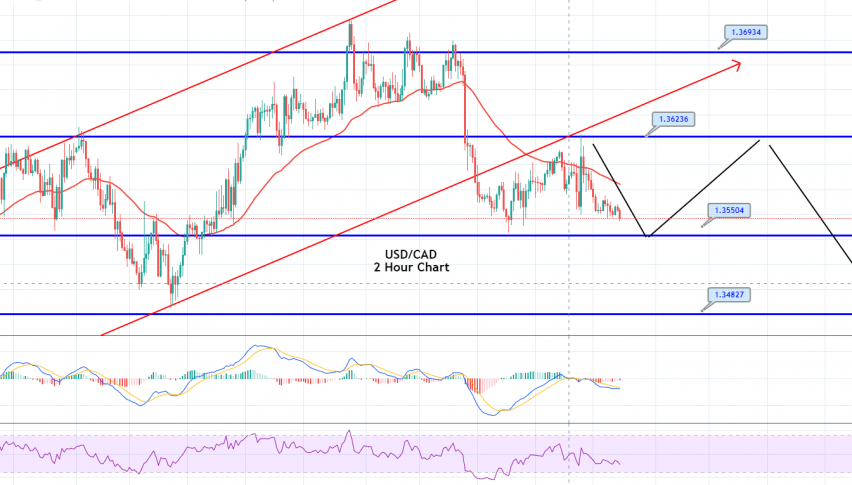
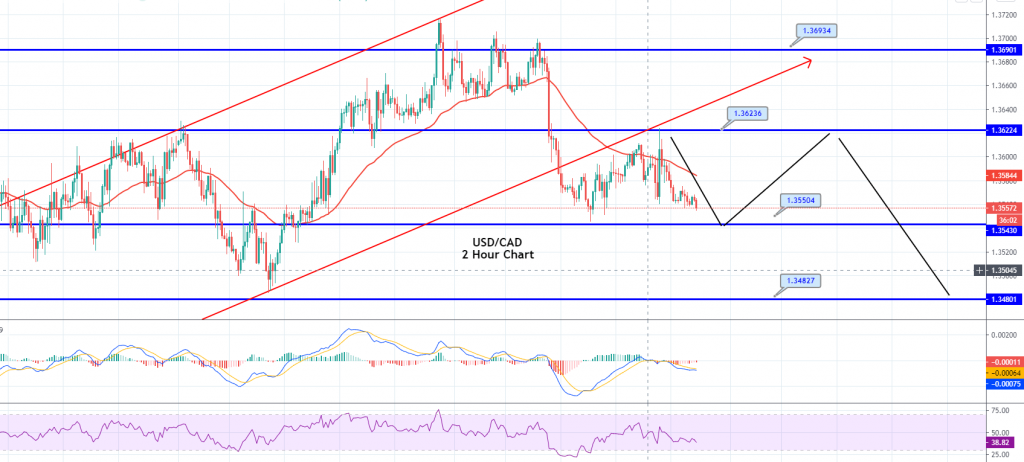
USD/CAD to Trade Sideways Range – Brace for a Breakout!
The USD/CAD is trading in a narrow trading range of 1.3550, and below this, the next support level is likely to be found at around the 1.348
The USD/CAD pair closed at 1.35623, after placing a high of 1.36238 and a low of 1.35603. Overall, the movement of the USD/CAD pair remained bearish throughout the day. The USD/CAD pair moved in a bearish trend on Thursday, amid increased demand for the Canadian dollar, in the wake of improving crude oil prices. WTI Crude Oil rose above $40 per barrel, due to increased hopes for a vaccine, after the reports suggested a potential COVID-19 vaccine had provided positive results in Phase1 and Phase 2 trials. The rise in Crude Oil helped commodity-linked Loonie to gain traction, dragging the USD/CAD pair.
On the data front, at 17:30 GMT, the Trade Balance from Canada for May showed a deficit of 0.7B against the expected deficit of 3.0B, supporting the Canadian dollar and dragging the USD/CAD pair lower. At 18:30 GMT, the Manufacturing PMI from Canada rose to 47.8 in June, from April’s 40.6 supporting the Canadian dollar, which eventually weighed on the USD/CAD pair.
The US dollar was strong across the board, due to the better-than-expected Non-Farm Payroll data, but after the release of Unemployment Claims from the US, traders became cautious. The mixed US employment data confused traders about the trend of the market.
During early trading hours on Thursday, the US dollar gained traction on the back of improved job creation, despite the second wave of the coronavirus. But after the number of jobless Americans who had applied for unemployment claims in the previous week rose, the US dollar lost its attraction.
At 17:30 GMT, the US Average Hourly Earnings decreased to -1.2%, the US Non-Farm Employment Change increased by 4.8M, the US Unemployment Rate dropped to 11.1%, and the US Unemployment Claims reached 1.427M, with a US trade deficit of 54.6B. The US Dollar Index rose to 97.25 after dropping to 97.00, as an initial response to NFP data. This also helped the USD/CAD pair to limit its losses on Thursday.
Daily Technical Levels
Support Resistance
1.3554 1.3613
1.3519 1.3637
1.3494 1.3672
Pivot point: 1.3578
The USD/CAD is trading in a narrow trading range of 1.3550, and below this, the next support level is likely to be found at around the 1.3480 level. On the hourly chart, the 50 periods EMA is supporting the selling bias, along with the MACD and the RSI. Let’s consider taking sell trades below the 1.3578 level today, to target 1.3540 to begin with. Good luck!
- Check out our free forex signals
- Follow the top economic events on FX Leaders economic calendar
- Trade better, discover more Forex Trading Strategies
- Open a FREE Trading Account