AUD/USD Tests Double Top – Traders Watch for a Breakout!
The AUD/USD is likely to face immediate resistance at the 0.6975 level, and closing of the candle below this level could drive selling...
The AUD/USD pair closed at 0.69358, after placing a high of 0.69474 and a low of 0.69136. Overall, the movement of the AUD/USD pair remained bullish throughout the day. The AUD/USD pair extended its previous daily gains, rising for the 5th consecutive day on Friday, on the back of improved risk appetite in the market. The Aussie currency, which is perceived as risky, continued its bullish streak for the 5th day, due to positive macroeconomic data from the US & China, and the weakness of the US dollar.
The US Dollar was weak across the board on Friday, due to the absence of US traders amid Independence Day celebrations, coupled with an increased number of corona infections in US states. On Thursday, Florida alone recorded 10,000 cases out of a total of over 52,000 new cases in the US. The increasing number of COVID-19 cases weighed on the US dollar, pushing the AUD/USD pair on Friday.
On the other hand, the risk sentiment was a little high in the market after a positive Caixin Services PMI was released from China. At 6:45 GMT, the Caixin Services PMI for June surged to 58.4, from the expected 53.8, providing support for the China-proxy Australian Dollar. The strong Aussie gave AUD/USD prices a push on Friday.
The economic data from Australia related to Retail Sales and the AIG Construction Index also added gains to the AUD/USD pair on Friday. At 3:30 GMT, the AIG Construction Index came in at 35.5 for June, compared to 24.9 for May, lending support to the Australian Dollar.
At 6:30 GMT, the Retail Sales for Australia for the month of May were reported to have increased by 16.9%, compared to the forecast 16.3%, lending support to the Australian Dollar. The strong Aussie added further to the upward trend of the AUD/USD pair on Friday.
However, the AUD/USD pair’s gains remained limited, due to the rising tensions between the US & China. The US deployed two aircraft carriers in the South China Sea, which indicated a show of force and rising tensions between the US & China.
These two nations have many areas of conflict, including trade, the COVID-19 pandemic, Taiwan, Hong Kong, and Uighurs Muslim human rights issues. These conflicts demonstrated the disruptive situation between the world’s biggest economies, weighing on Aussie to keep a lid on additional gains in the AUD/USD pair.
Daily Technical Levels
Support Resistance
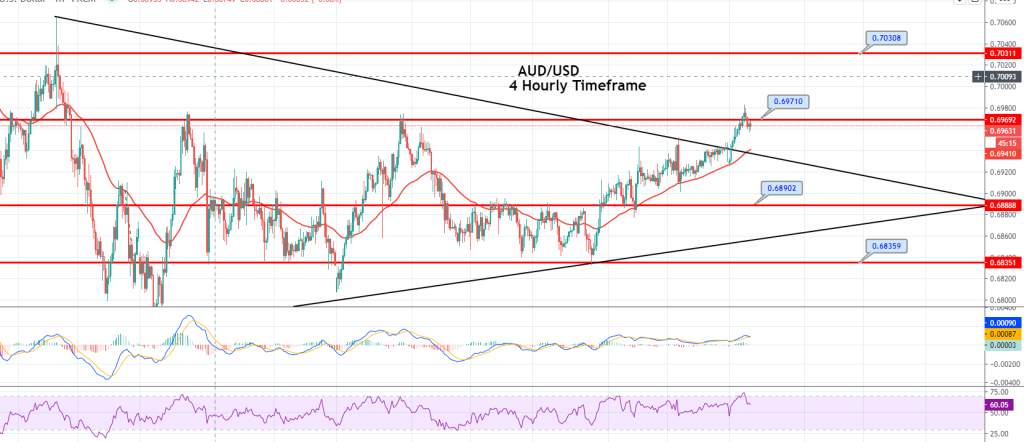
0.6919 0.6957
0.6897 0.6973
0.6881 0.6995
Pivot point: 0.6935
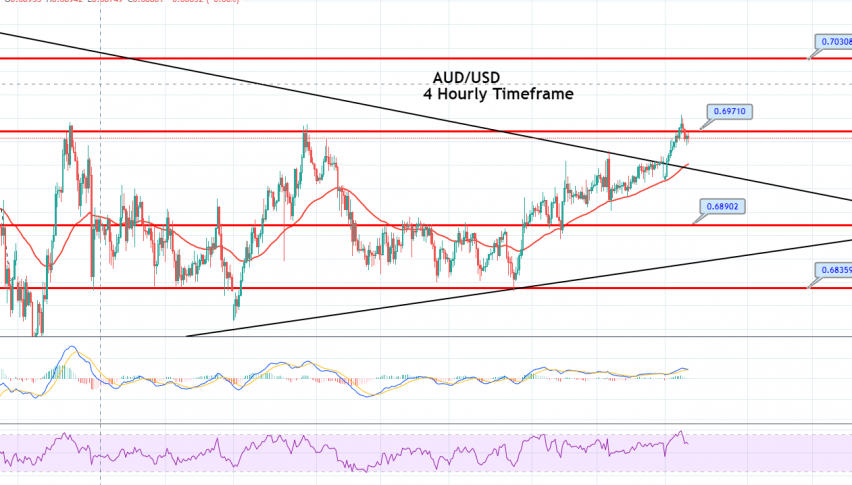
The AUD/USD is likely to face immediate resistance at the 0.6975 level, and closing of the candle below this level could drive selling. By the look of recent candles, the chances of a bullish breakout seem stronger. Thus, the AUD/USD could chase the 0.7045 level upon breaking out of the 0.6975 resistance level. Good luck!
- Check out our free forex signals
- Follow the top economic events on FX Leaders economic calendar
- Trade better, discover more Forex Trading Strategies
- Open a FREE Trading Account
- Read our latest reviews on: Avatrade, Exness, HFM and XM
Related Articles
Sidebar rates
