USD/CAD Heading to Our TP Target After Failing at the 100 SMA
USD/CAD retreated higher during June, but the pullback seems over on the H4 chart
[[USD/CAD]] surged 15 cents higher during March, as the panic set in from the outbreak of the coronavirus and crude Oil tumbled lower. As a result, the CAD declined as well, sending USD/CAD surging higher. But, the climb ended and the trend turned bearish, as crude Oil recuperated all the losses.
Towards the end of May and during June, we saw another decline, taking the price to 1.33 for this pair. But, by the middle of June, USD/CAD started to retrace higher and this pair has been puling back higher, although the pullback seems quite weak, compared to the bearish move which was very strong.
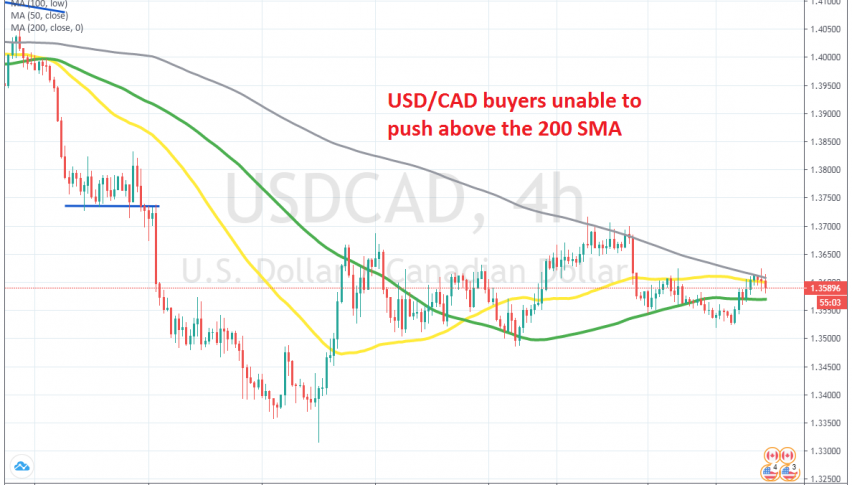
The price moved above the 50 SMA (yellow) and the 100 SMA (green) on the H4 chart, but the 200 SMA (grey) held as resistance during the last week of June. The price retreated to 1.35 and buyers had another attempt to break the 200 SMA, but it was holding again yesterday and we decided to open a sell forex signal. Now, USD/CAD is heading down again after being rejected by the 200 SMA, so our trade here seems to be in the right track.
- Check out our free forex signals
- Follow the top economic events on FX Leaders economic calendar
- Trade better, discover more Forex Trading Strategies
- Open a FREE Trading Account
- Read our latest reviews on: Avatrade, Exness, HFM and XM
Related Articles


Sidebar rates
Related Posts
