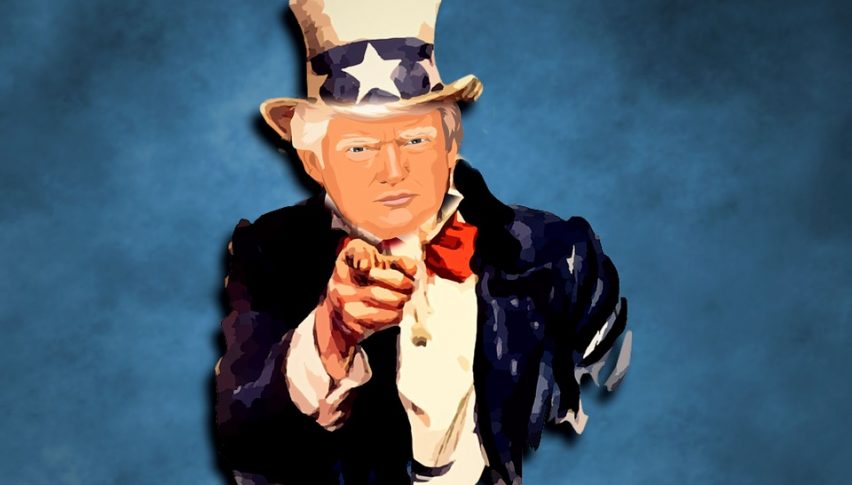
U.S. Election 2020: Update And Odds
If you believe polls and betting odds, Joe Biden appears to be the next POTUS. Of course, predicting the future is never that easy.

Election years are no picnic and 2020 has been one for the history books. Headlined by the COVID-19 pandemic, extreme market volatility, and social unrest, the past seven months have brought unprecedented uncertainty. Let’s tackle the biggest political question of the year: Who will be the next President of the United States?
Election 2020: Polls And Odds
It’s no secret that political polling is far from a science. 2016 showed us that bigly, with two seemingly impossible events ― Brexit and Donald Trump’s election ― coming to fruition. As late as Election Day 2016, polls from the New York Times gave Trump only a 15% chance of winning. With fall 2020 rapidly approaching, the scenario appears to be shaping up much the same.
About 100 days out from the November general election, polling data is stacked firmly against the presidential incumbent. Here’s a look at the latest polls from Real Clear Politics:
- NBC News/Wall Street Journal: Biden +11
- CNBC/Change Research: Biden +10
- Rasmussen Reports: Biden +3
- Quinnipiac: Biden +15
- Economist: Biden +9
According to these numbers, Biden has a sizable advantage. The eyebrow-raiser here is the Quinnipiac poll, showing Biden with an edge of 15 points. This is a huge number and mirrors polls that had Clinton +15 on August 4, 2016.
At this point, the academics have Biden way ahead of Trump in the race for the White House. And, the gamblers agree. Over at Predictit.org, the wagering markets are giving Biden a 62% chance of winning and Trump 38%. Further, several leading online sportsbooks have Trump installed as a 1.5/1 underdog in the 2020 presidential election.
DJIA At A Critical Juncture
2020 has been a whirlwind for markets around the globe. U.S. stocks are no different, posting a huge yearly range. For the DJIA DOW, the recovery from March’s COVID-19 panic has been robust. Values are now testing the 78% Fibonacci Retracement of the COVID-19 market crash (27,070).
++26_2019+-+29_2020.jpg)
Overview: If you take a look at the weekly chart above, you can see that 27,000 has been under fire since early June. This is a key level to watch; if it gives way, then new all-time highs are possible by Election Day. If not, this technical area may prove to be a long-term turning point for U.S. large-cap stocks.
So, who is going to win the election? If you believe the polls and betting odds, then Biden appears to be the clear-cut victor. Of course, predicting the future is never that easy. Given the surging COVID-19 pandemic, anything is possible in the United States. More lockdowns, mail-in voting, and another market crash are all feasible scenarios. Attempting to measure the impact of these variables on the election is close to impossible; all we can really do is wait and see.
One thing is for sure ― there will be plenty of solid trading opportunities to be had between now and November 3rd.
- Check out our free forex signals
- Follow the top economic events on FX Leaders economic calendar
- Trade better, discover more Forex Trading Strategies
- Open a FREE Trading Account


