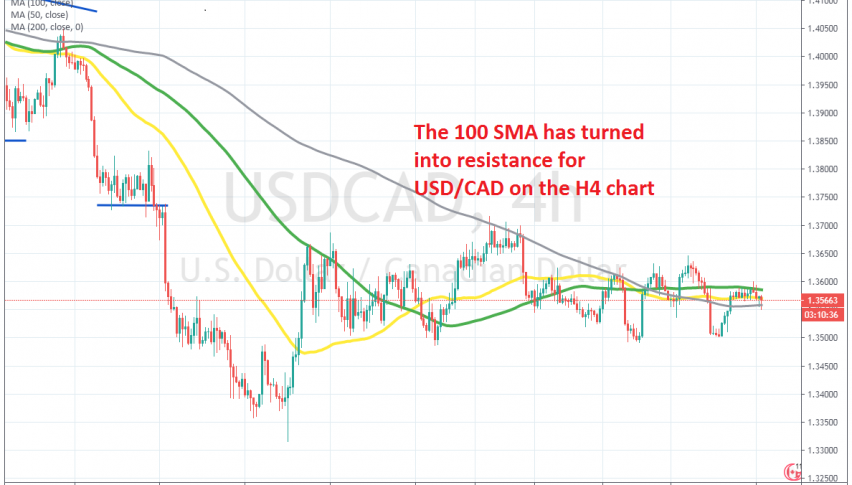
The 100 SMA Is Keeping USD/CAD Subdued
USD/CAD turned higher last week, but the 100 SMA is topping it from climbing higher on the H4 chart
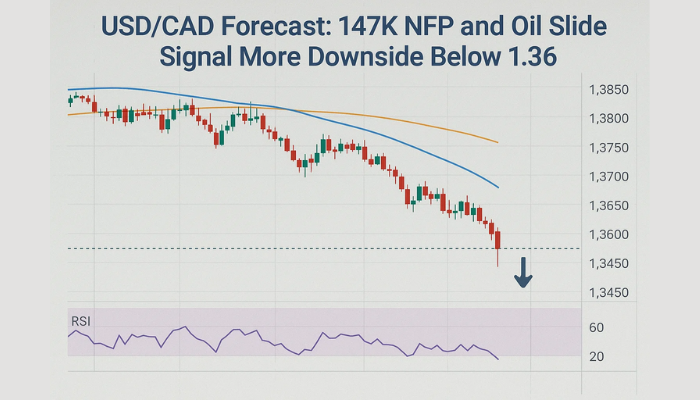
[[USD/CAD]] has been bearish since the middle of March, when it reversed down, following a 15 cent surge during the first two weeks of that month, as a result of the coronavirus outbreak. Markets turned into the USD as a global reserve currency, while the CAD tumbled together with Oil.
But, the panic wore off and USD/CAD turned bearish again. This pair has been quite bearish until the middle of last month, when it fell to 1.33. Since then, USD/CAD has been trading sideways inside a range, between 1.35 and 1.37, while the range is narrowing.
Moving averages were providing resistance on the H4 chart during June, but they have all go bundled together now and the price has moved above and below them a few times. But it seems like the 10 SMA (green) has turned into resistance now. We opened a buy forex signal last week, based on the daily chart and USD/CAD reversed higher. But this moving average is stopping it from climbing higher, so we will see who will win this battle between buyers and sellers now.
- Check out our free forex signals
- Follow the top economic events on FX Leaders economic calendar
- Trade better, discover more Forex Trading Strategies
- Open a FREE Trading Account