The Short-Term Trend Seems to Have Changed for AUD/USD
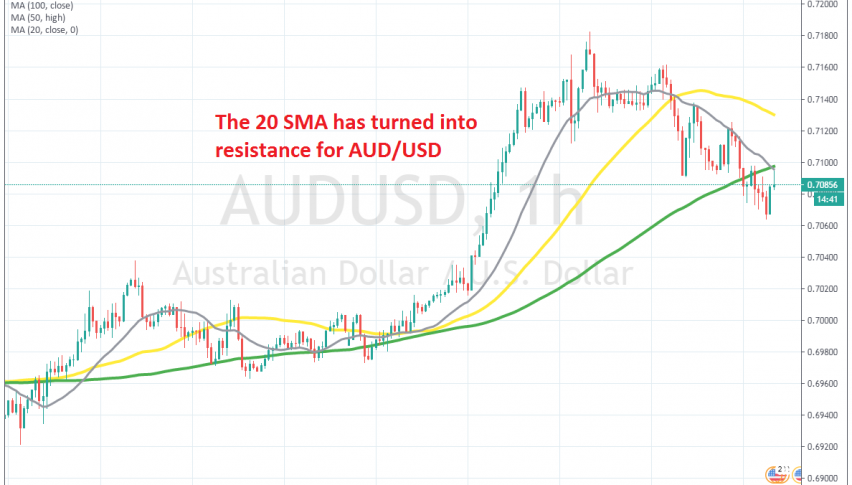
The 20 SMA has turned into resistance for AUD/USD on the H1 chart, as the intra-day trend changes
[[AUD/USD]] has been one of the most bullish pairs during the last several months. It crashed around 12 cents lower during the first two weeks of March, as panic set in, but then turned bullish after that and since mid March AUD/USD has climbed around 17 cents.
During this time, we have opened quite a few buy forex signals in this pair, while on Tuesday we saw this pair make another assault to the upside, climbing nearly 200 pips. But, the climb stopped short of the 0.72 level and this pair has declined around 120 pips lower do far.
During the bullish move higher, moving averages were keeping this pair supported, but now it seems like the situation has changed on the smaller time-frames. This pair as slipped below moving averages on the H1 chart, which now seem to have turned into resistance. The 20 SMA (grey) turned into resistance first, while today the 100 SMA (green) joined it, reversing the price lower after the pullback higher. So, the pressure seems to have turned to the downside now and we might open a sell forex signal at the 20 SMA.
- Check out our free forex signals
- Follow the top economic events on FX Leaders economic calendar
- Trade better, discover more Forex Trading Strategies
- Open a FREE Trading Account


