NZD/USD Trying to Make Up Its Mind Between 2 MAs Today
NZD/USD has retreated lower since Friday, but the 100 SMA is holding as support on the H4 chart
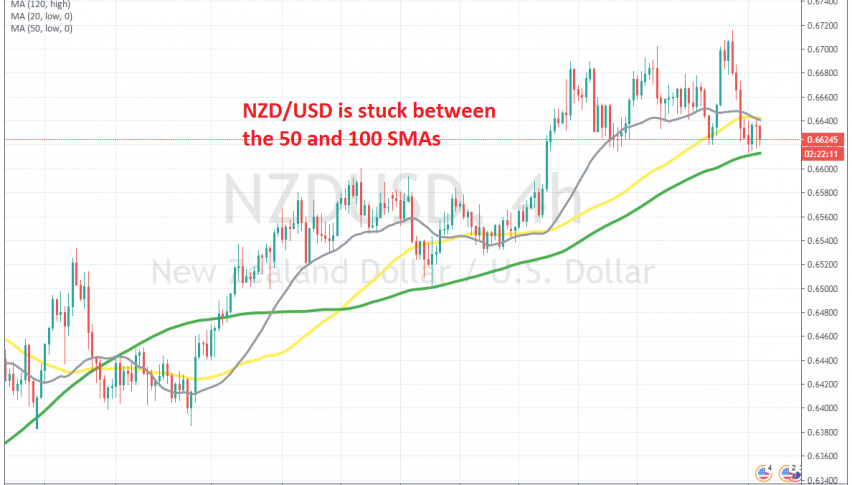
[[NZD/USD]] has been quite bullish since the middle of March, when it reversed higher after the big crash, due to the coronavirus outbreak in Europe and the US. As a result, this pair has ben climbing higher since then, claiming around 12.5 cents from the bottom.
Buyers have been totally in charge since then, but on Friday last week we saw a pullback lower. We decided to go long at the 20 SMA (grey) on the H4 chart, since it had been providing support during the last two weeks on the H4 chart, as shown above.
But, the selloff continued, as the USD gained strength, after being really bearish for a few months. The decline continued and NZD/USD broke below the 20 SMA and the 50 SMA (yellow). But, the decline stopped right at the 100 SMA (green), which has been providing support since then. We decided to open another buy signal above the 100 SMA, so we are long on NZD/USD again, hoping for a bounce from here, given that the main trend is still bullish.
- Check out our free forex signals
- Follow the top economic events on FX Leaders economic calendar
- Trade better, discover more Forex Trading Strategies
- Open a FREE Trading Account


