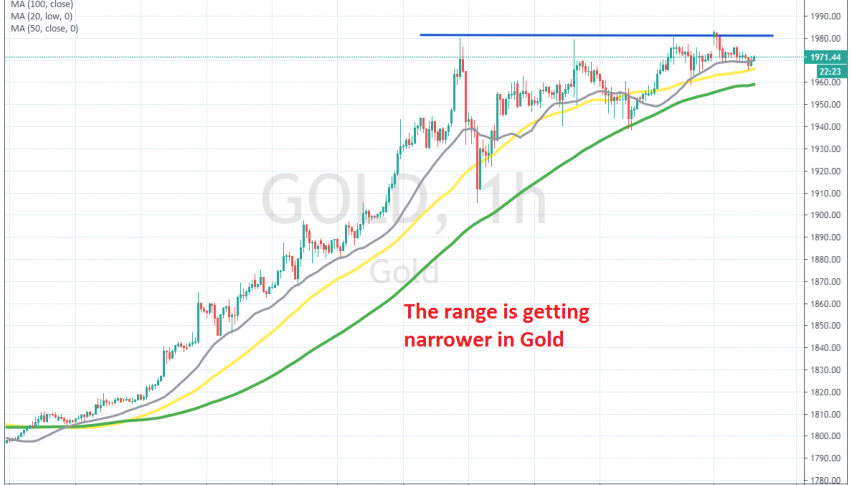
The Range Is Narrowing in Gold, Between MAs and the Resistance
Gold has formed a resistance area on top, while MAs are pushing it higher from the bottom
GOLD has been bullish for about two years now, after it turned higher, as the trade war between US and China escalated. Although, the bullish momentum picked up pace this year, after the coronavirus spread outside of China, which turned the sentiment really negative, adding fuel to the upside for safe havens such as Gold.
Gold broke above the resistance at $1,915 last week, which was the all time high, so the road is wide open for $2,000 and above. The reason for the last bullish push in Gold, which has increased Gold’s value by $550 came as a result of the USD crashing lower.
Moving averages have been doing a great job in providing support during pullbacks lower. The larger period MAs like the 100 SMA (green) have done this job when pullbacks were stronger, while the smaller ones such as the 20 SMA (grey) and the 50 SMA (yellow)have yakenup that job when the pace of the bullish trend got stronger.
Although, a resistance area has formed above $1,980, while MAs are pushing the price higher. So, the range is getting narower in Gold and the chart points to a bullish break higher, since lows are getting higher, but we will see which way the break will come, because nothing is written in stone. If the upside breaks, then the resistance will eventually turn into support for Gold.
- Check out our free forex signals
- Follow the top economic events on FX Leaders economic calendar
- Trade better, discover more Forex Trading Strategies
- Open a FREE Trading Account
- Read our latest reviews on: Avatrade, Exness, HFM and XM
Related Articles


Sidebar rates
Related Posts
