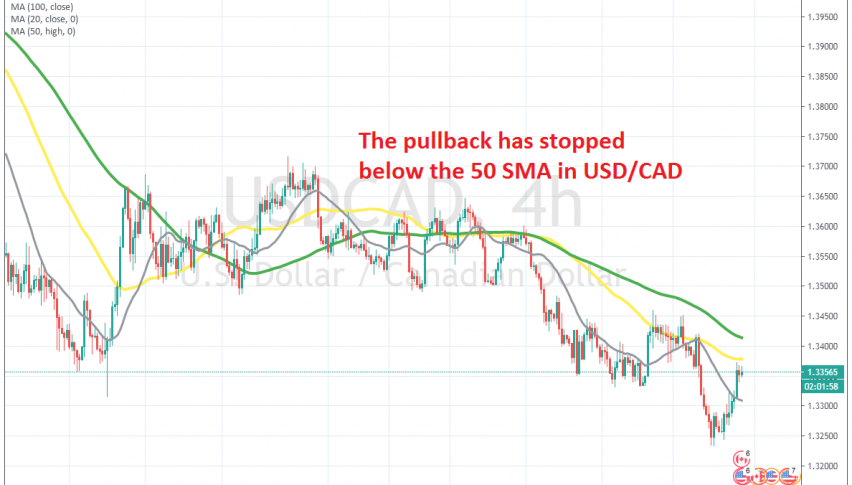
Shorting the Pullback in USD/CAD Below the 50 SMA
USD/CAD has retraced higher today, but the 50 SMA is stopping the climb on the H4 chart
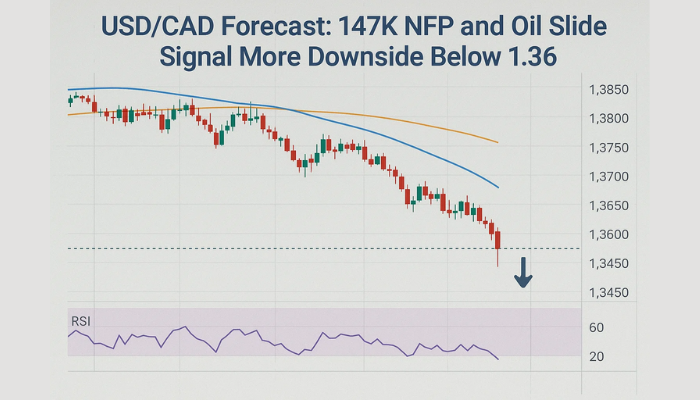
[[USD/CAD]] has been on a bearish trend since the middle of March, when the surge in the USD ended and the commodity currencies stopped crashing down. The risk sentiment improved, despite the increased uncertainty regarding the future of the global economy, helping the CAD further.
In late May and early June this pair went through another decline, but it stopped at 1.3350-60 where it formed a bottom, which held until late July when the support area was broken. The USD went through another phase of selling and USD/CAD fell to 1.3230.
But, we saw the price pullback higher yesterday in the US session, which stretched further up today. We opened a sell signal overnight at the 20 SMA (grey), but the pullback continued higher to the 50 SMA (yellow) on the H4 chart, which is providing resistance. We decided to take another shot and just opened another sell forex signal below the 50 SMA. The retrace higher has stopped now, so let’s hope the bearish trend will resume soon, since the price is overbought on the H4 chart.
- Check out our free forex signals
- Follow the top economic events on FX Leaders economic calendar
- Trade better, discover more Forex Trading Strategies
- Open a FREE Trading Account