The 50 Daily SMA Is Supporting Dax Now
Dax has tried to reverse down this week, but the 50 SMA is holding as support on the daily chart
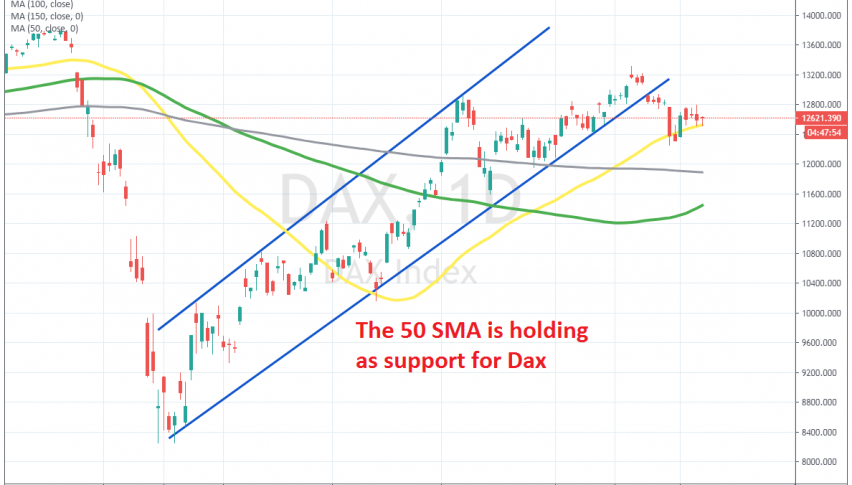
Stock markets have been on a constant bullish trend since the middle of March, following the big crash earlier that month. From the middle of March until late July DAX traded inside a bullish channel, taking the price more than 5,000 points higher.
But, the price formed an upside-down hammer in the last week of July at the top, which is a bearish reversing signal. The price reversed down and lost more than 1,000 points, as the sentiment turned negative for a while. Dax broke below the 50 SMA (yellow) on the daily chart, but climbed back up on Monday.
Although, sellers seem to be hanging around still, with the price is trading around the 50 SMA. But, it seems like the 50 SMA is still holding as support for Dax. Sellers have tried to reverse the price lower in the last two days, but the 50 SMA has held its ground. So, the 50 SMA is acting as support and we might open another buy forex signal here soon.
- Check out our free forex signals
- Follow the top economic events on FX Leaders economic calendar
- Trade better, discover more Forex Trading Strategies
- Open a FREE Trading Account