Crude Oil Bounces Off the 200 SMA, but Stalls at the 50 SMA
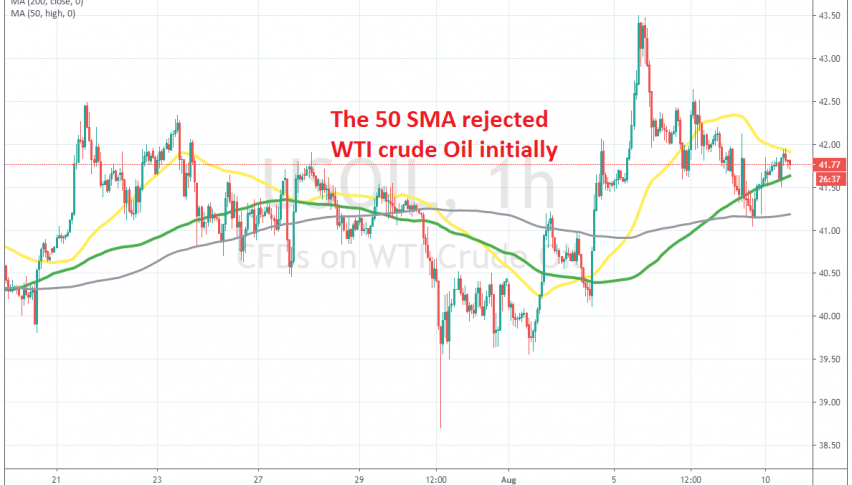
Crude Oil has reversed higher, but the 50 SMA is stopping it on the H1 chart

Crude Oil has been bullish since the big reversal at mid May, when US WTI crude traded at -$37. Since then, buyers have been in total control, having pushed the price around $80 higher from the bottom. We did see a decent pullback last week, when Oil fell to $38.70, but buyers returned pretty quick.
They reversed the price higher, pushing to $43.50s, where they gave up. During the last two days of last week, US WTI crude fell to $41, but the 200 SMA (grey) held as support on the H1 chart. The price pierced that moving average for a while, but eventually closed above it, so it didn’t count as a break.
The price bounced higher during the last session on Friday, taking the price nearly 200 pips higher, close to $42. But, that’s where the 50 SMA (yellow) was standing and that moving average provided resistance, as we can see form the H1 chart above.
The price has started to slip lower from there and a bearish reversing pattern is forming on this time-frame, as well as on the H4 chart. This looks like a good selling opportunity, since the USD is climbing higher and the uncertainty remains high, which is not good for risk assets such as Oil. So, we might open a sell forex signal here.
- Check out our free forex signals
- Follow the top economic events on FX Leaders economic calendar
- Trade better, discover more Forex Trading Strategies
- Open a FREE Trading Account


