Getting Ready to Buy AUD/USD at the 100 SMA
AUD/USD has been rejected by the 50 SMA on the H4 chart today
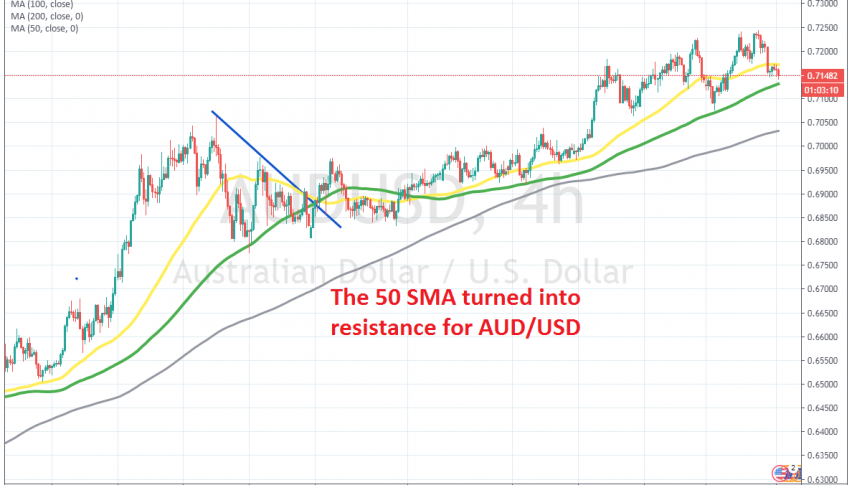
[[AUD/USD]] has been bullish since the middle of March, having climbed more than 12 cents from the bottom, up to the top, which was put in place last week at 0.7240s. During the climb, moving averages such as the 100 SMA (green) have been providing support on the H4 chart.
Although, since the middle of last week we have seen this pair retrace lower, as the USD has finally started to come back, after being bearish for more than two months. The price started to reverse after forming a couple of doji candlesticks at the top, which are bearish reversing signals.
The price slipped below the 50 SMA (yellow), which has turned into resistance now. AUD/USD tried to turn bullish earlier today, but it failed at the 50 SMA. Now the price has reversed back down and it seems to be heading for the 100 SMA. When it gets there, we will follow it closely to see for a bullish reversing candlestick. If we get that, we might go long on AUD/USD at the 100 SMA.
- Check out our free forex signals
- Follow the top economic events on FX Leaders economic calendar
- Trade better, discover more Forex Trading Strategies
- Open a FREE Trading Account
- Read our latest reviews on: Avatrade, Exness, HFM and XM
Related Articles
Sidebar rates
