The Double Top Pattern Points to 1.15 for EUR/USD
EUR/USD has formed a double top pattern on the daily chart
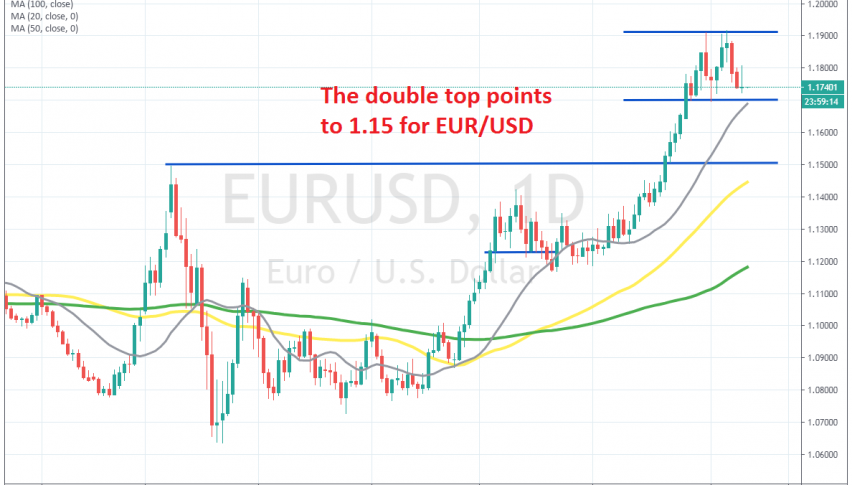
[[EUR/USD]] has been bullish during the last several months, especially since May, after comments for an EU coronavirus recovery fund. The fund was increased from EUR750 million to EUR1.35 billion, which improved the sentiment further for the Euro, while the USD was crashing lower on the other hand.
The previous resistance zone around 1.15 which provided resistance in March, was broken without much hustle for the buyers. They pushed above 1.19 on the last day of July, but the price retreated back down, falling around 200 pips lower, where it bounced higher, after forming a hammer candlestick, which is a bullish reversing signal.
EUR/USD climbed above 1.19 for the second time, but the resistance zone above that level held once again. This pair formed a doji last Thursday, which is a bearish reversing signal this time, after the climb. The price reversed down and now it seems to be heading for the previous resistance at 1.15.
So, after two attempts failing above 1.19, the larger picture shows a double top pattern on the daily chart. This pattern points to a 200 pip decline to 1.15, if the neckline at 1.17 breaks, since the distance between the neckline and the top is round 200 pips wide. But, the neckline has o be broken first. Although, I don’t think that I will sell the break immediately, but rather wait for a pullback there from below and see if it will turn into resistance.
- Check out our free forex signals
- Follow the top economic events on FX Leaders economic calendar
- Trade better, discover more Forex Trading Strategies
- Open a FREE Trading Account
- Read our latest reviews on: Avatrade, Exness, HFM and XM
Related Articles


Sidebar rates
Related Posts
