The 100 SMA Keeps EUR/USD Bullish
EUR/USD has declined to the 100 SMA, but it's not bouncing from there
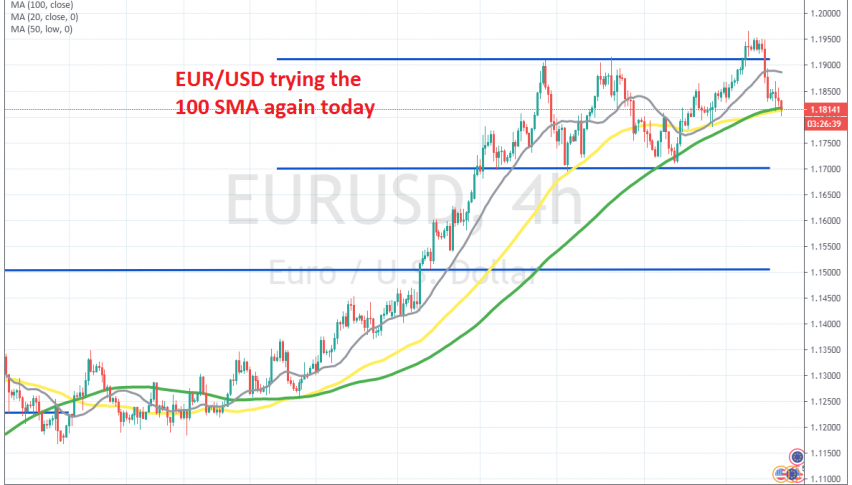
[[EUR/USD]] has been bullish for a few months, since the middle of May when it finally reversed higher. Although, the uptrend picked up pace during July, as EUR/USD surged nearly 8 cents, although that had more to do with the weakness in the USD than the Euro strength.
This pair topped above 1.19 in early August and after a pullback to 1.17, it tried the upside once again. But, buyers failed above 1.19 once again, which gave the impression that the bullish move might have been coming to an end. EUR/USD reversed back down, but the previous support at 1.17 held its ground again.
The price broke above 1.1950 this time, which gave the impression that buyers were back in control and the bullish trend was back on. But, the climb stopped there and EUR/USD turned lower yesterday, falling around 150 pips. But, the 100 SMA is holding as support again, this time aided by the 50 SMA (yellow) as well. Although, we are not seeing a bounce yet, so there might be a break of these MAs soon. if EUR/USD break the MAs and falls to 1.17, then we might look for a long trade there if it hold as support.
- Check out our free forex signals
- Follow the top economic events on FX Leaders economic calendar
- Trade better, discover more Forex Trading Strategies
- Open a FREE Trading Account


