The 50 Daily SMA Holds As Support for NZD/USD
NZD/USD bounced off the 50 SMA on the daily chart, but the 20 SMA is stopping it now
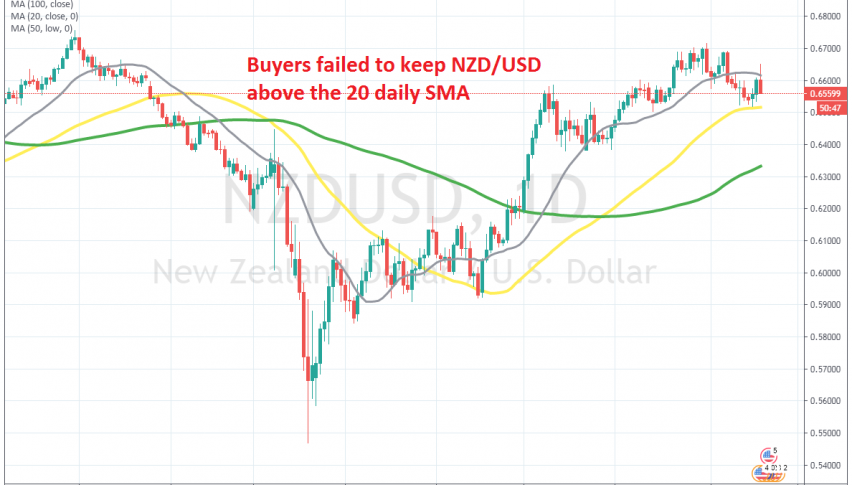
[[NZD/USD]] has been bearish for two years, but in Q4 of last year we saw a retrace higher, as a result of an improving sentiment in financial markets. But the retrace ended on December 31, when this pair formed a doji candlestick, which is a bearish reversing pattern.
The bearish reversal came and the decline picked up pace when the coronavirus spread in the West. NZD/USD tumbled below 0.55, but it reversed and has been bullish since then. Buyers found some slight resistance at the 20 SMA (grey) and the 50 SMA (yellow) on the daily chart.
But, they pushed above them eventually and those moving averages turned into support, as the daily chart shows. NZD/USD has been retreating from the highs this year and broke below the 20 SMA, but the 50 daily SMA held as support and the price bounced off of it.
Although, the 20 SMA has turned into an obstacle now. If it break soon, then the bullish trend is back on, if not, then we might we a deeper pullback lower, but sellers will have to break the 50 SMA before that happens, so we will see how this pair evolves from here.
- Check out our free forex signals
- Follow the top economic events on FX Leaders economic calendar
- Trade better, discover more Forex Trading Strategies
- Open a FREE Trading Account