MAs Continue to Keep Oil Bullish on the Daily Chart
Crude Oil has found solid support on MAs on the daily chart
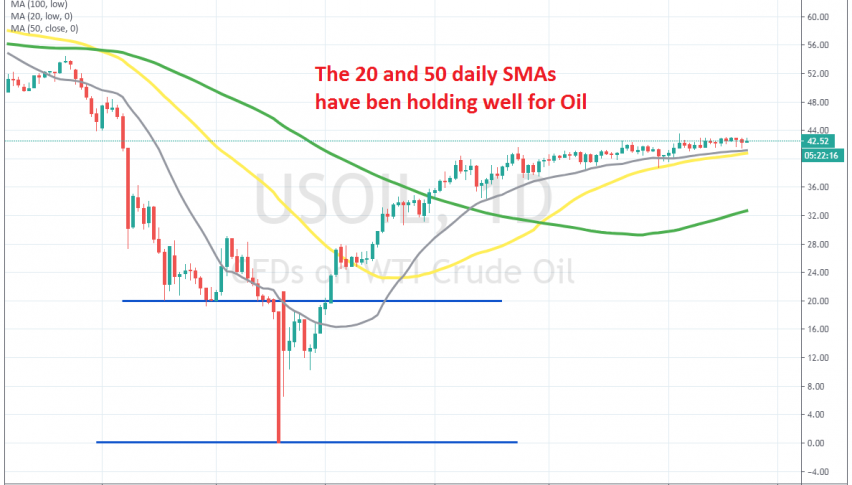
Crude Oil recuperated quite well in the weeks following the big crash, which sent US WTI crude to -$37.50. Crude Oil gained around $80 in less than 2 months, which is considerable, but the pace of the increase has fallen dramatically since then.
In fact, the highs have stalled at $43, since early August, when buyers pushed briefly to $43.50. So, the upside pressure is getting weaker. But, the lows are getting higher nonetheless and moving averages have been helping on the daily chart keeping crude Oil supported.
The 20 SMA (grey) provided support initially in June and it has been pushing lows higher since then. But, as the trend slowed further this month, the 50 SMA caught up with the price in the last day of July and it is adding strength to the support. So, despite the highs stalling, crude Oil remains on a bullish trend as long as it stays above the MAs, which are also a good place to go long from on the daily chart.
- Check out our free forex signals
- Follow the top economic events on FX Leaders economic calendar
- Trade better, discover more Forex Trading Strategies
- Open a FREE Trading Account


