GBP/USD Faces the 50 Daily SMA, After Bouncing off the 200 SMA
GBP/USD has bounced off the 50 SMA as the USD turns weaker again

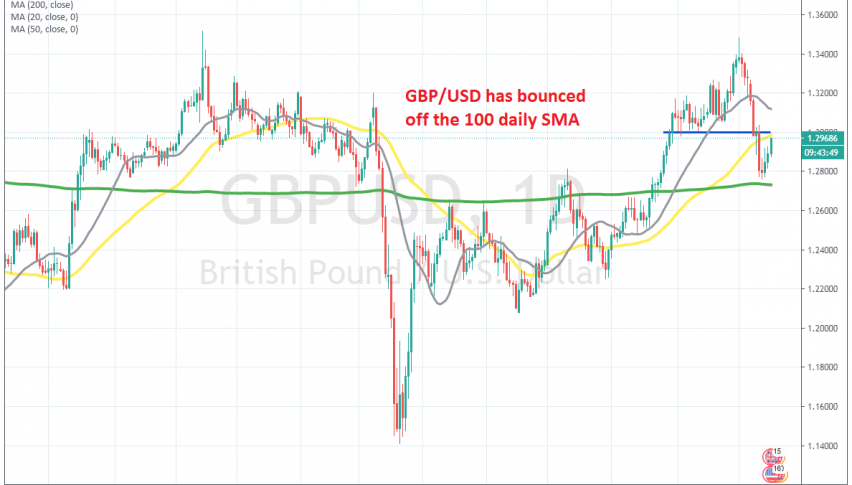
The GBP/USD turned quite bearish earlier this month, after failing to break above the big round level at 1.35 on September 1. From there, the currency pair lost around 750 pips until Friday last week, when it reached the 200 SMA (green) on the daily chart, as shown in the chart above.
Brexit has come back into the spotlight, as the coronavirus slowly goes out of focus, and the situation doesn’t look too promising for a trade deal between the UK and the EU. That’s been hurting the sentiment surrounding the GBP, hence the steep decline of the last two weeks.
But, the 200 SMA was acting as resistance for this pair before, and it held the decline today, which means that it turned into support for the GBP/USD. The price bounced from there, after forming a doji candlestick, which is a bullish reversing signal after the decline.
But this pair is facing the 50 daily SMA (yellow) now, close to 1.30, which is another major level. So, it seems like the 50 SMA might be a good place to sell GBP/USD. However, we will wait to see if a bearish reversing candlestick forms up there, which would be the green light for shorts.
- Check out our free forex signals
- Follow the top economic events on FX Leaders economic calendar
- Trade better, discover more Forex Trading Strategies
- Open a FREE Trading Account


