The Decline Seems Over for USD/CAD, After Climbing Above the 200 SMA


[[USD/CAD]] turned extremely bullish during Q1 of this year, surging from 1.2950s to 1.4660s until the middle of March. The USD was surging higher while the CAD was declining, following crude Oil lower. Oil kept declining until the middle of April, but this pair turned bearish in March.
The reversal at 1.4660s turned into a strong bearish trend, which continued until September 1, taking the price back below 1.30. But as we have mentioned before, the big round level at 1.30 wasn’t broken, because no candlestick were closed below it.
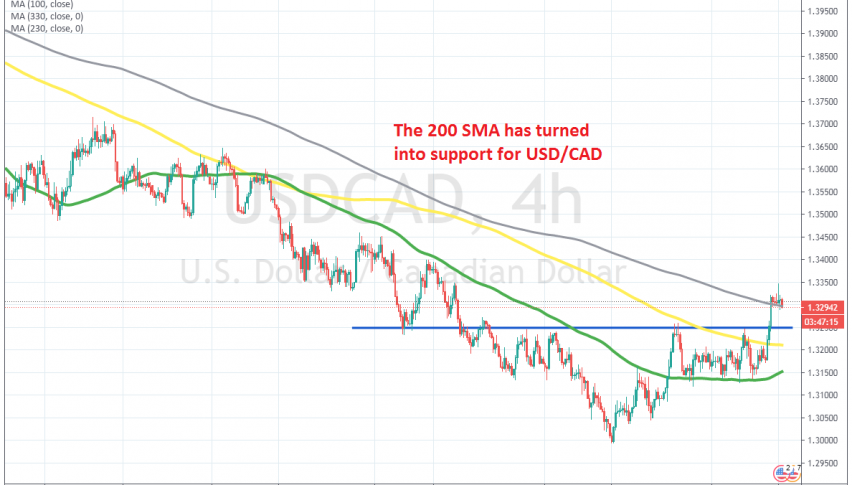
USD/CAD reversed higher earlier this month and broke above moving averages, but a resistance zone was formed at 1.3250s where buyers were having trouble pushing the price above it. Although, the bearish reversal in crude Oil yesterday gave this pair a push higher, sending it above the 200 SMA (grey) on the H4 chart, which turned into support immediately. This is a sign that the pressure has shifted to the upside for this pair now. So, we’ll be trying to buy retraces lower in USD/CAD in the following weeks.