The Previous Support at 1.1750s Turns Into Resistance for EUR/USD
EUR/USD retraced higher this week, but the support at 1.1750 turned into resistance
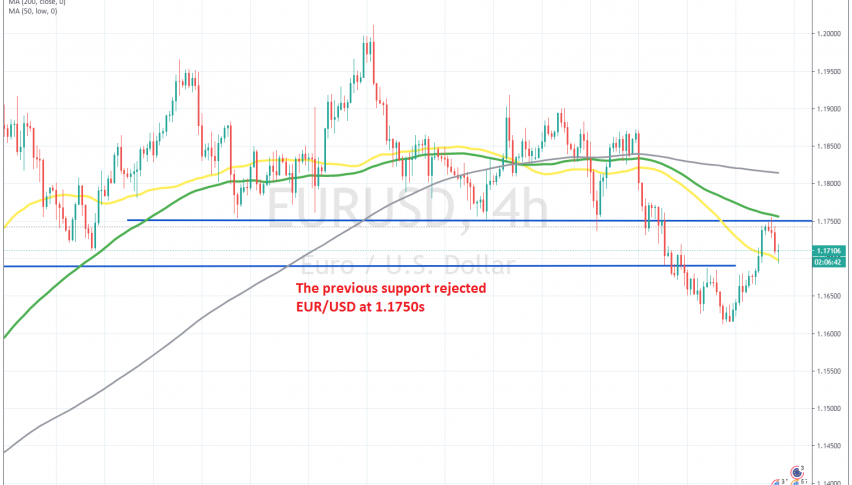
The EUR/USD turned bearish last week, after breaking below the previous support at 1.1750. This pair has been on a strong bullish trend since March, as the USD turned bearish during the coronavirus pandemic. The price climbed above 1.20 briefly on September 1, but reversed down quite quickly, which was a sign that buyers were running out of steam.
Since then, the highs have been getting lower, which is another bearish signal, and the support at 1.1750, which has held the price for more than a month, was broken. The price fell to 1.1610s but this week, we have been seeing this pair retrace higher.
But for now, the retrace seems to complete on the H4 chart. The 100 SMA (green) held as resistance, helped by the previous support at 1.1750, which seems to have turned into resistance now. The EUR/USD reversed down from there this morning, but the price is finding support on the 50 SMA (yellow). If the 50 SMA breaks soon, the EUR/USD will head down for 1.16 and probably 1.15, otherwise, it should bounce to the 100 SMA again, where we might open a sell signal if the resistance holds.
- Check out our free forex signals
- Follow the top economic events on FX Leaders economic calendar
- Trade better, discover more Forex Trading Strategies
- Open a FREE Trading Account
- Read our latest reviews on: Avatrade, Exness, HFM and XM
Related Articles


Sidebar rates
Related Posts
