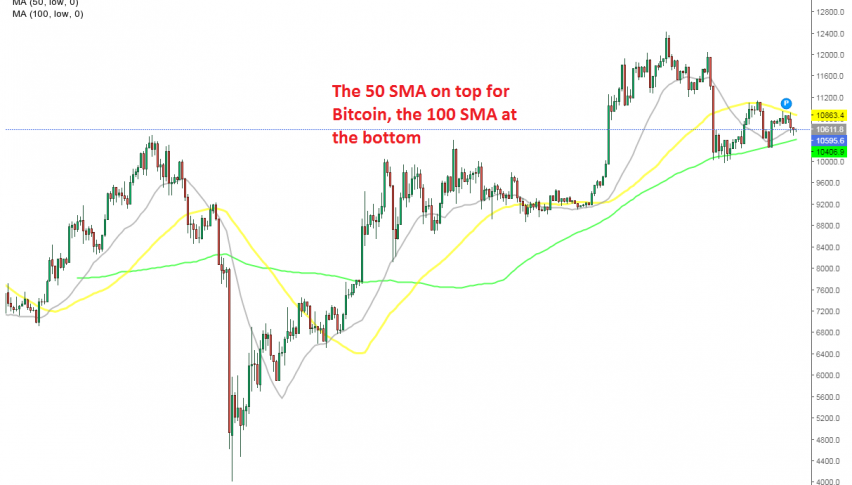
Bitcoin Stuck in A Tight Range Between the 50 and 100 SMAs
Bitcoin has been bouncing between 2 MAs since September on the daily chart

The coronavirus crisis had a major impact on the crypto market, as well as in other financial markets. The initial panic sent BITCOIN diving from around $10,000 in December last year, to just above $4,000. This shows that the digital currency market is not immune to political or economic shocks happening around the globe.
But then the trend reversed as the USD got weaker and the sentiment improved as the world reopened again. The uptrend continued until the middle of August, as Bitcoin reached $12,500, but after forming and head and shoulders pattern, the price tumbled more than $2,000 lower.
The 100 SMA (green) was pierced on the daily chart, as was the $10,000 level. But, they didn’t break, since all daily candlesticks closed above that big round level and above the 100 SMA. The price bounced off the 100 SMA and climbed above $11,000, but the 50 SMA turned into resistance and stopped the climb.
The price returned back down, but the 100 SMA held as support again on this time-frame. Then we saw another bounce and another rejection from the 50 SMA. Now the price is headed back down for the third time. So, a ping-pong game is happening in BITCOIN now, which is bouncing between two moving averages on the daily chart.
We have not been trading this range, since the spread is quite wide, but might buy if the price forms a bullish reversing pattern at the 100 SMA again, hoping that the bullish trend will resume properly this time and Bitcoin will jump to around $12,000 at least.
- Check out our free forex signals
- Follow the top economic events on FX Leaders economic calendar
- Trade better, discover more Forex Trading Strategies
- Open a FREE Trading Account


