USD/JPY Back Up at the 50 Daily SMA
The 50 SMA rejected USD/JPY last week, but the price has reversed back up there again today
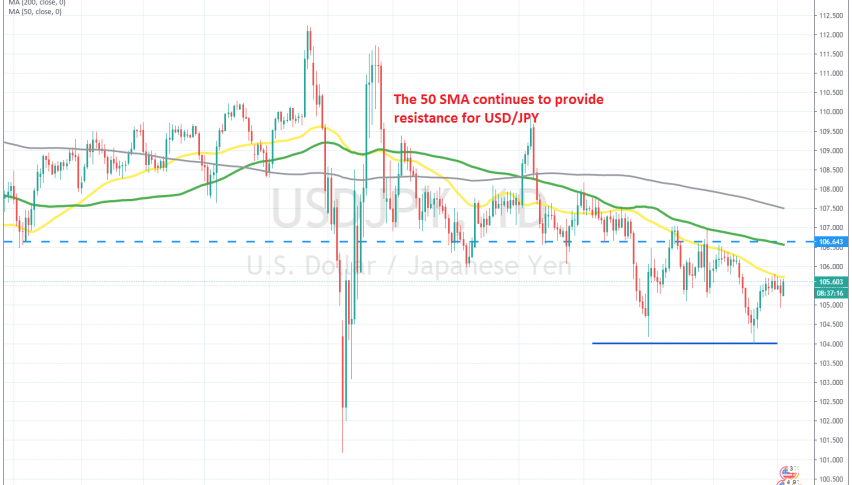
[[USD/JPY]] has been on a slight bearish trend since the roller-coaster ride which sent this pair 11 cents down and then up ended. Highs have been getting lower since March and moving averages have turned into resistance for USD/JPY since the beginning of July.
The 100 SMA (green) was providing resistance at first, but then the 50 SMA took over, as highs kept declining. sellers tried the downside at the middle of September, pushing this pair to 104, but the price retraced back up at the end of last month.
Although, this moving average held again as resistance on the daily chart and last Friday we saw another run to the downside, as the sentiment turned negative for the USD again, on Trump’s coronavirus infection. But today Trump seems to be back on the job, so the risk has passed and USD/JPY has reversed back up to the 50 SMA.
This might be a good opportunity to go short on USD/JPY, but the quick reversal up looks suspicious. We will follow the price action a bit longer and probably open a sell signal later, is we get a bearish reversing signal on the smaller time-frame charts.
- Check out our free forex signals
- Follow the top economic events on FX Leaders economic calendar
- Trade better, discover more Forex Trading Strategies
- Open a FREE Trading Account


